March 2020 eases winter’s drought
Air Temperature
| Highest Maximum | 22.2°C | 2nd |
| Lowest Maximum | 13.3°C | 30th |
| Highest Minimum | 13.9°C | 1st |
| Lowest Minimum | 8.8°C | 26th |
| Mean Maximum | 16.8°C |
| Mean Minimum | 11.6°C |
| Mean | 14.2°C |
Relative Humidity
| Highest Relative Humidity | 100% | Several days |
| Lowest Relative Humidity | 40% | 2nd |
| Mean Relative Humidity | 84.2% |
Atmospheric Pressure
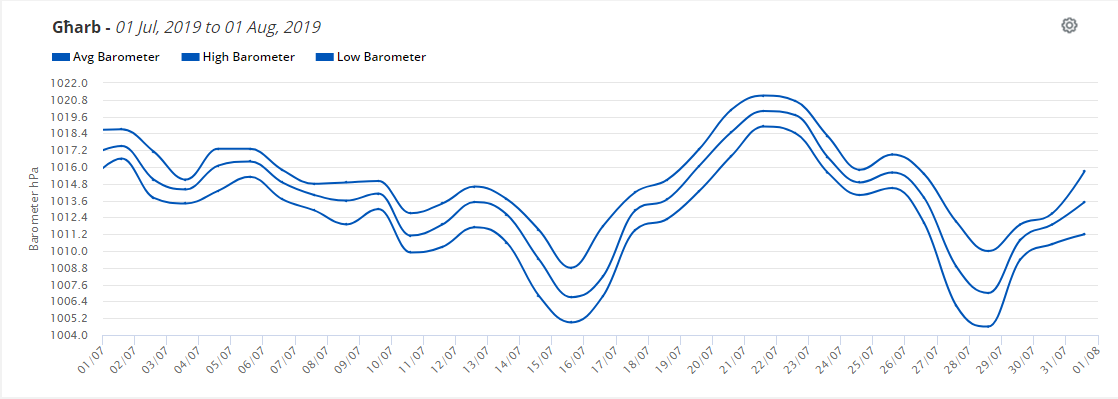
| Highest Atmospheric Pressure | 1028.7hPa | 17th |
| Lowest Atmospheric Pressure | 995.6hPa | 25th |
| Mean Atmospheric Pressure | 1015.5hPa |
Wind
| Highest Gust | 72.4km/h | 26th |
| Mean Wind Speed | 11.9km/h |
| Mean Gust Speed | 37.9km/h |
| Mean Wind + Gust Speed | 24.9km/h |
| Most Frequent Wind Direction | Northwest |
Precipitation
| Total Rainfall During March 2020 | 33.3 mm |
| Total Rainfall Since Last 01/09 | 391.7 mm |
| Highest 24 Hour Total | 10.3 mm | 10th |
| Rain Days | 10 |
| Thunderstorm Days | 1 |
| Hail Days | 1 |
Rainfall Events
| 04/03/2020 | 0.5 mm | Isolated Light Rain |
| 05/03/2020 | 1.6 mm | Isolated Showers |
| 09/03/2020 | 1.4 mm | Isolated Showers |
| 10/03/2020 | 10.3 mm | Showers |
| 21/03/2020 | 0.6 mm | Isolated Light Rain |
| 24/03/2020 | 0.2 mm | Brief Light Rain/Drizzle |
| 25/03/2020 | 9.5 mm | Showers; Isolated Thunderstorm with Hail |
| 26/03/2020 | 1.6 mm | Isolated Light Rain |
| 27/03/2020 | 1.5 mm | Isolated Light Rain |
| 30/03/2020 | 6.1 mm | Showers; Persistent Drizzle |
March 2020 Compared to the Climate Means
| Climate Mean | March 2020 | Anomaly | |
| Mean Maximum Temperature | 17.0°C | 16.8°C | -0.2°C |
| Mean Minimum Temperature | 10.9°C | 11.6°C | +0.7°C |
| Mean Temperature | 14.0°C | 14.2°C | +0.2°C |
| Mean Relative Humidity polska-ed.com | 79% | 84.2% | +5.2% |
| Mean Atmospheric Pressure | 1016.1hPa | 1015.5hPa | -0.6hPa |
| Mean Wind Speed | 18.9 km/h | 11.9km/h | -7.0km/h |
| Most Frequent Wind Direction | Northwest | Northwest | 0° |
| Total Rainfall | 39.8 mm | 33.3 mm | -6.5 mm |
| Total Rainfall Since Last 01/09 | 512.8 mm | 391.0 mm | -121.8 mm |
| Total Rain Days | 7 | 10 | +3 |
| Total Thunderstorm Days | 2 | 1 | -1 |
| Total Hail Days | 1 | 1 | 0 |
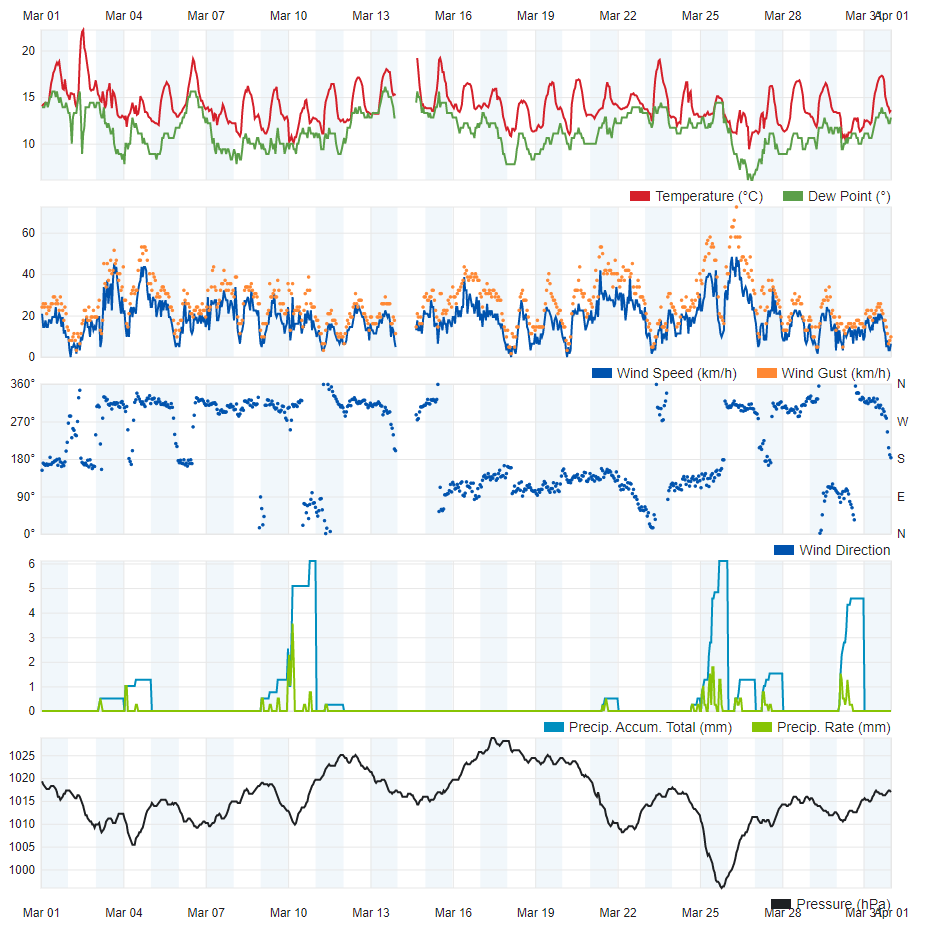
March 2020 eases winter’s drought
With 33.3 mm of rain, March 2020 was wetter than both January 2020 and February 2020 combined. Only 6.4 mm were measured in the previous two months combined. The total of 33.3 mm still means that last month was, albeit by a narrow margin, drier than average. Some localities around the Maltese Islands had a wetter March though. It was down to the spatial variation in heavy rain cells on the 25th and 30th. The 10.3 mm measured on the 10th was the highest 24 hour total since last 11th December All in all, March 2020 helped ease the drought that has gripped the Maltese Islands since the beginning of December 2019.
A glance at data reveals that the Maltese Islands experienced a typical March temperature-wise. The mean temperature of 14.2°C was only a marginal 0.2°C above the climatic average. Daytime highs averaged 16.8°C, 0.2°C below the norm. Delving deeper, however, will reveal that nighttime lows were on the whole more than half a degree warmer than usual. Values of air temperature varied evenly over the course of March 2020. A notable observation is the lowest maximum temperature of 13.3°C, measured on the 30th. No day was as cold in either January 2020 or February 2020.
March is typically one of the windiest months locally. March 2020 was much calmer, with only one day of gale-force winds. This was the 26th, when the month’s highest wind gust of 72.4 km/h from the Northwest was measured.
Atmospheric pressure clocked in at an average 1015.5hPa, slightly below the average for this time of year. This was a stark contrast to atmospheric pressure readings in January 2020 and February 2020. Both months were characterised by extremely high atmospheric pressure. It was the result of a strong positive North Atlantic Oscillation (NAO). The pattern flipped during March. A strong high pressure developed close to the British Isles. This expanded to cover a large part of central and northern Europe. The high pressure over those regions deviated the storm track south, encouraging low pressure systems to reach the central Mediterranean.