Reports

End of Month Reports

Significantly Colder in March 2022

Air Temperature

Highest Maximum 24.6°C 31st
Lowest Maximum 11.9°C 9th
Highest Minimum 14.2°C 31st
Lowest Minimum 3.9°C 25th


Mean Maximum 15.5°C
Mean Minimum 9.4°C
Mean 12.4°C


Relative Humidity

Lowest Relative Humidity 45% 9th


Mean Relative Humidity 75.7%


Wind

Highest Gust 53.1km/h 18th


Mean Wind Speed 12.5km/h
Most Frequent Wind Direction East Southeast


Atmospheric Pressure

Highest Atmospheric Pressure 1035.0hPa 15th
Lowest Atmospheric Pressure 996.8hPa 31st


Mean Atmospheric Pressure 1020.9hPa


Precipitation

Total Rainfall During March 2022 21.2 mm
Total Rainfall Since Last 01/09 551.5 mm


Highest 24 Hour Total 13.7 mm 13th


Rain Days 10 days
Thunderstorm Days 2 days
Hail Days 1 day


Rainfall Events

01/03/2022 0.3 mm Light Rain Shower. Hail and Thunder in Vicinity.
05/03/2022 0.5 mm Light Rain
07/03/2022 0.8 mm Light Rain
12/03/2022 3.3 mm P.M. Rain
13/03/2022 13.7 mm A.M. Rain. Thunder in Vicinity.
19/03/2022 0.8 mm Light Rain
20/03/2022 0.5 mm Light Rain
21/03/2022 0.5 mm Light Rain
30/03/2022 0.5 mm Light Rain
31/03/2022 0.3 mm Light Rain


March 2022 Compared to the Climate Means

  Climate Mean March 2022 Anomaly
Mean Maximum Temperature 17.3°C 15.5°C -1.8°C
Mean Minimum Temperature 10.7°C 9.4°C -1.3°C
Mean Temperature 14.0°C 12.4°C -1.6°C
Mean Relative Humidity 79% 75.7% -3.2%
Mean Atmospheric Pressure 1016.1hPa 1020.9hPa +4.8hPa
Total Rainfall 40.7 mm 21.2 mm -19.5 mm
Total Rainfall Since Last 01/09 538.5 mm 551.5 mm +13.0 mm
Total Rain Days 9 days 10 days +1 day
Total Thunderstorm Days 2 days 2 days /
Total Hail Days 1 day 1 day /


SIGNIFICANTLY COLDER in MARCH 2022

March 2022 continued the colder than average trend set in previous months. In fact, March turned out to be as cold as February. The mean temperature of 12.4°C was a staggering 1.6°C colder than the norm for this time of year. The mean maximum of 15.5°C and mean minimum of 9.4°C were 1.8°C and 1.3°C colder than the climate mean respectively. March 2022 was the coldest March in decades. The mercury dipped to a chilly 3.9°C in the early hours of the 25th, making that night one of the coldest March nights on record. Less than a week later, at around noon on the 31st, the Maltese Islands experienced one of the warmest March days in recent years. The temperature spiked to 24.6°C at our weather station on the final day of the month. Values were even higher in areas further inland. Minimum temperatures dropped to below the 10°C mark on a total of eighteen nights. The only average or slightly warmer than average days came in the month’s final week, indicating the much anticipated start of spring’s gradual rise in temperatures.

Although rainfall over the course of March 2022 was lower than the average, there was still a marked improvement over the previous month. The 21.2 mm accumulated by the end of the month were around half the total rainfall expected in a typical March. The bulk fell in a rainy episode halfway through the month (12th and 13th). The rest were produced by sporadic rain showers. Much of these showers deposited fine desert sand brought over by a predominant Sirocco wind.

Half of last month featured winds blowing from the Sirocco quarter. In fact, most days during March 2022 featured a hazy sky. This was due to the abundant fine desert sand blown across the Mediterranean by the southerly winds. Last month’s highlight was a gale-force wind from the East Southeast on the 18th and 19th.

The meteorological situation across Europe was fairly uniform last month. The meteorological situation over eastern Europe was characterized by an unusually strong and extensive area of high pressure. This anticyclone had been stationary over the region for a long while. Such a meteorological setting helped maintain a persistent stream of cold air from Siberia all the way to the central Mediterranean, keeping temperatures locally below the climatic norm. Further to this, a fairly stable atmosphere across our area deviated most rain-bearing systems to the north, maintaining the drier weather. The colder air further aggravated the situation. Things took a turn to a more seasonal meteorological setting by the final week of the month. Systems of low pressure of north African origin started developing over Tunisia. These traversed the central Mediterranean bringing warmer temperatures, elevated levels of humidity, dustier air and southerly winds.

Rainfall Totals around the Maltese Islands in March 2022 (and since last September 1st):

Għarb: 21.2 mm (551.5 mm)

Victoria: 23.7 mm (572.5 mm)

Xewkija: 18.7 mm (534.1 mm)

Nadur: 23.9 mm (607.5mm)

Marsalforn: 15.8 mm (610.0 mm)

Mellieħa: 19.0 mm (536.4 mm)

Buġibba: 22.0 mm (608.4 mm)

Mġarr: 21.8 mm (578.0 mm)

Naxxar: 22.7 mm (619.3 mm)

Mosta: 20.0 mm (523.4 mm)

Dingli: 23.5 mm (479.9 mm)

Msida: 20.4 mm (583.4 mm)

Valletta: 14.8 mm (363.0 mm)

Imqabba: 30.2 mm (563.3 mm)

Żabbar: 17.1 mm (582.5 mm)

Birżebbuġa: 14.3 mm (421.2 mm)

Sliema: 15.7 mm (567.0 mm)

NATIONAL MEAN: 20.3 mm (547.5 mm)

End of Month Reports

Significantly Drier in February 2022

Air Temperature

Highest Maximum 17.0°C 15th
Lowest Maximum 13.2°C 28th
Highest Minimum 13.0°C 19th
Lowest Minimum 5.3°C 9th


Mean Maximum 15.2°C
Mean Minimum 9.4°C
Mean 12.3°C


Relative Humidity

Lowest Relative Humidity 43% 8th


Mean Relative Humidity 78.4%


Atmospheric Pressure

Highest Atmospheric Pressure 1032.9hPa 9th
Lowest Atmospheric Pressure 1002.9hPa 1st


Mean Atmospheric Pressure 1020.7hPa


Wind

Highest Gust 59.5km/h 1st


Mean Wind Speed 14.3km/h
Most Frequent Wind Direction Northwest


Precipitation

Total Rainfall During February 2022 5.0 mm
Total Rainfall Since Last 01/09 530.3 mm


Highest 24 Hour Total 3.3 mm 1st


Rain Days 4 days
Thunderstorm Days 0 days
Hail Days 1 day


Rainfall Events

01/02/2022 3.3 mm Rain and Hail Showers
11/02/2022 0.3 mm Dew
13/02/2022 0.3 mm Dew
14/02/2022 0.3 mm več Light Rain
16/02/2022 0.5 mm Light Rain
23/02/2022 0.3 mm Light Rain


February 2022 Compared to the Climate Means

  Climate Mean February 2022 Anomaly
Mean Maximum Temperature 15.7°C 15.2°C -0.5°C
Mean Minimum Temperature 9.5°C 9.4°C -0.1°C
Mean Temperature 12.6°C 12.3°C -0.3°C
Mean Relative Humidity 78% 78.4% +0.4%
Mean Atmospheric Pressure 1016.6hPa 1020.7hPa +4.1hPa
Mean Wind Speed 19.1km/h 13.3km/h -5.8 km/h
Total Rainfall 61.6 mm 5.0 mm -56.6 mm
Total Rainfall Since Last 01/09 497.8 mm 525.3 mm +27.5 mm
Total Rain Days 11 days 4 days -7 days
Total Thunderstorm Days 3 days 0 day -3 days
Total Hail Days 1 day 1 day /


Significsntly Drier in February 2022

Rain over the course of February 2022 was very scarce. In fact, it was among the driest ever. Total daily rainfall exceeded 1.0 mm on only one day. This was on the 1st, when 3.3 mm were measured at our weather station. By the end of the month, 5.0 mm of rain had accumulated. This was from isolated light rain and/or dewfall on a number of days. February 2022 received less than 10% of the rain one would expect over the course of a typical February. No locality in the Maltese Islands accumulated more than 10 mm of rain last month. This serious lack of rainfall may be blamed on successive zones of high pressure that characterised the meterorological situation around the western Mediterranean. This prevented low pressure systems from reaching the central Mediterranean. The sheer stability that dominated much of last month was reflected in readings of atmospheric pressure and wind speed. Readings of atmospheric pressure were frequently above average for this time of year. No major gales were experienced last month. February is normally a very windy month locally.

Temperatures were overall cooler than average. This could be due to persistent zones of high pressure over central and eastern Europe. These patterns of atmospheric pressure direct cold air from northern Europe towards the Mediterranean. A number of nights were characterized by clear skies and a lack of wind. Clear skies at night allow heat to escape into the atmosphere, allowing air temperatures to dip. The coldest temperature last month was measured at 5.3°C, in the early hours of the 9th. A total of twelve nights registered minimum temperatures below the climate norm. Overall, with a difference of – 0.3°C from the mean, air temperatures were only marginally colder.

Rainfall Totals around the Maltese Islands in February 2022 (and since last September 1st):

Għarb: 5.0 mm (530.3 mm)

Victoria: 5.8 mm (548.8 mm)

Xewkija: 5.6 mm (515.4 mm)

Nadur: 2.3 mm (583.6mm)

Marsalforn: 5.1 mm (594.2 mm)

Mellieħa: 4.9 mm (517.4 mm)

Buġibba: 5.2 mm (586.4 mm)

Mġarr: 3.6 mm (556.2 mm)

Naxxar: 5.8 mm (596.6 mm)

Mosta: 3.9 mm (503.4 mm)

Dingli: 5.9 mm (456.4 mm)

Msida: 5.6 mm (563.0 mm)

Valletta: 6.4 mm (348.2 mm)

Imqabba: 3.3 mm (533.1 mm)

Żabbar: 7.8 mm (565.4 mm)

Birżebbuġa: 3.1 mm (406.9 mm)

Sliema: 3.5 mm (551.3 mm)

NATIONAL MEAN: 4.9 mm (527.2 mm)

End of Month Reports

Colder than Average in January 2022

Air Temperature

Highest Maximum 18.2°C 5th
Lowest Maximum 9.3°C 25th
Highest Minimum 12.8°C 3rd and 4th
Lowest Minimum 2.9°C 12th


Mean Maximum 14.3°C
Mean Minimum 8.9°C
Mean 11.6°C


Relative Humidity

Lowest Relative Humidity 44% 23rd


Mean Relative Humidity 77.8%


 Atmospheric Pressure

Highest Atmospheric Pressure 1032.1hPa 19th
Lowest Atmospheric Pressure 997.7hPa 10th


Mean Atmospheric Pressure 1021.3hPa


 Wind

Highest Gust 59.5km/h 10th


Mean Wind Speed 13.3km/h
Most Frequent Wind Direction North Northwest


 Precipitation

Total Rainfall During January 2022 35.1 mm
Total Rainfall Since Last 01/09 525.3 mm


Highest 24 Hour Total 18.1 mm 13th


Rain Days 7 days
Thunderstorm Days 1 day
Hail Days 1 day


Rainfall Events

06/01/2022 1.3 mm Light Rain
09/01/2022 2.5 mm Showers
10/01/2022 6.6 mm Showers
12/01/2022 4.6 mm Showers
13/01/2022 18.1 mm Rainy
21/01/2022 0.5 mm Light Rain
24/01/2022 1.5 mm Rain and Hail Shower; Thunder


January 2022 Compared to the Climate Means

  Climate Mean January 2022 Anomaly
Mean Maximum Temperature 15.6°C 14.3°C -1.3°C
Mean Minimum Temperature 9.8°C 8.9°C -0.9°C
Mean Temperature 12.7°C 11.6°C -1.1°C
Mean Relative Humidity 79% 77.8% -2.2%
Mean Atmospheric Pressure 1018.2hPa 1021.3hPa +3.1hPa
Mean Wind Speed 18.9km/h 13.3km/h -5.6 km/h
Total Rainfall 94.1 mm 35.1 mm -59.0 mm
Total Rainfall Since Last 01/09 436.2 mm 525.3 mm +89.1 mm
Total Rain Days 14 days 7 days -7 days
Total Thunderstorm Days 3 days 1 day -2 days
Total Hail Days 1 day 1 day /


Colder than Average in January 2022

The new year started off on a relatively warm note, with the month’s air temperature peaking at 18.2°C on the fifth day. Temperatures were consistently above average throughout the first week of January. From then on, a drop in temperatures was registered. The synoptic situation for much of January 2022 was marked by persistent high pressure across western Europe and successive zones of low pressure over the Balkans. This meteorological caused a series of cold snaps to traverse the central and eastern Mediterranean, with the more intense ones coming towards the end of the month. Last month’s mean minimum temperature was calculated at 8.9°C. The coldest night was on the 25th, when the minimum temperature dipped to a frosty 2.9°C. This was the coldest night in seven years. The 25th also marked the first time in five years that the maximum temperature failed to reach the 10°C level.

Overall, January 2022 was a drier than average month. Rainfall totals varied widely, however, with a number of localities in fact registering rainfall totals which exceeded the climate norm. Gozo and the western half of Malta were the drier regions. Our weather station registered a poor total of 35.1 mm over the course of the month. Localities across northern and central Malta were luckier in terms of rainfall, with a few localities almost reaching the 100 mm mark. It is worth noting how on the days that Gozo and western Malta remained relatively dry, but localities elsewhere received abundant rainfall, the wind was blowing from a predominantly North Northwest direction. This creates a form of rain shadow whose impact is felt far more profoundly across these areas. A kind of rain shadow forms over the Maltese Islands when the wind across the central Mediterranean blows from a northerly direction. Cold northerly air moving towards the Maltese Islands encounters Sicily (including Mount Etna which stands at 3,326 meters above sea-level) on its way. The advancing air is forced to rise and condense, producing rain-bearing clouds over Sicily. Precipitation occurs and the moisture carried by the cold northerly air is lost. As the cold northerly air advances further south, the stretch of sea between Sicily and the Maltese Islands is not wide enough for the air to recharge with moisture. As a result, the air is too dry to form any rain-bearing clouds locally. As a result, very little rain occurs over the Maltese Islands. That is why a North wind rarely brings any rain to our shores. As explained earlier, the rain shadow effect produced when the wind blows from the North Northwest is felt more over Gozo and western Malta.

Rainfall Totals around the Maltese Islands in January 2022 (and since last September 1st):

Għarb: 35.1 mm (525.3 mm)

Marsalforn: 43.2 mm (589.1 mm)

Victoria: 45.3 mm (548.8 mm)

Xewkija: 41.4 (509.8 mm)

Nadur: 48.9 mm (581.3 mm)

Mellieħa: 36.1 mm (512.5 mm)

Buġibba: 73.3 mm (581.2 mm)

Naxxar: 98.3 mm (590.8 mm)

Dingli: 56.6 mm (450.5 mm)

Mġarr: 74.4 mm (552.6 mm)

Mosta: 99.6 mm (499.5 mm)

Msida: 78.8 mm (557.4 mm)

Sliema: 83.4 mm (547.8 mm)

Valletta: 35.6 mm (341.8 mm)

Imqabba: 82.9 mm (529.8 mm)

Żabbar: 46.0 mm (557.6 mm)

Birżebbuġa: 47.7 mm (403.8 mm)

NATIONAL MEAN: 60.4 mm (522.3 mm)

End of Year Reports

2021 – A Year of Meteorological Extremes

Air Temperature

Highest Maximum 40.8°C 20th June 2021
Lowest Maximum 10.2°C 15th February 2021
Highest Minimum 27.7°C 5th August 2021
Lowest Minimum 5.9°C 15th February 2021


Mean Maximum 23.0°C
Mean Minimum 16.7°C
Mean 19.8°C


Relative Humidity

Lowest Relative Humidity 18% 28th June 2021


Mean Relative Humidity 74.1%


Atmospheric Pressure

Highest Atmospheric Pressure 1035.2hPa 23rd February 2021
Lowest Atmospheric Pressure 998.3hPa 21st March 2021


Mean Atmospheric Pressure 1018.6hPa


Wind

Highest Gust 78.9 km/h (Force 9) 7th February 2021


Mean Wind Speed 17.3 km/h
Most Frequent Wind Direction Northwest


Precipitation

Total Rainfall During 2021 558.0 mm


Highest 24 Hour Total 69.5 mm 3rd October 2021


Rain Days 80 days
Thunderstorm Days 27 days
Hail Days 13 days


Rainfall Events

01/01/2021 0.6 mm P.M. Shower
02/01/2021 8.5 mm Isolated Thunderstorm
03/01/2021 4.3 mm P.M. Rain/Hail Showers; Distant Thunder
04/01/2021 3.2 mm A.M. Rain/Hail Showers; Distant Thunder
08/01/2021 0.3 mm Isolated Light Rain
12/01/2021 2.3 mm Rain/Hail Showers
13/01/2021 0.5 mm Light Rain
14/01/2021 0.3 mm Light Rain
15/01/2021 1.5 mm Isolated Shower
16/01/2021 1.7 mm Isolated Rain/Hail Shower
17/01/2021 1.6 mm Isolated Shower (Hailstorm in Malta)
18/01/2021 2.1 mm Shower
23/01/2021 0.3 mm Light Rain
24/01/2021 0.3 mm Light Rain
26/01/2021 5.9 mm Showers
27/01/2021 0.5 mm Light Rain
28/01/2021 7.2 mm Showers
31/01/2021 0.3 mm Light Rain
02/02/2021 1.8 mm Isolated Shower
13/02/2021 1.1 mm Light Rain
14/02/2021 0.5 mm Light Rain
08/03/2021 1.3 mm Light Rain
09/03/2021 0.3 mm Light Rain
10/03/2021 0.9 mm Light Rain
16/03/2021 3.7 mm Isolated Showers; Thundery Shower with Hail
18/03/2021 3.6 mm Isolated Showers
20/03/2021 0.5 mm Light Rain (with heavy sand deposits)
21/03/2021 4.6 mm Showers
22/03/2021 0.8 mm Light Rain
23/03/2021 5.6 mm Showers; Thundery Shower with Hail
30/03/2021 0.3 mm Dew
05/04/2021 1.4 mm Isolated Shower
04/09/2021 3.6 mm Thunderstorm
06/09/2021 1.5 mm Isolated Thunderstorm
09/09/2021 2.6 mm Isolated Shower; Distant Thunder
10/09/2021 1.5 mm Isolated Shower; Distant Thunder
11/09/2021 0.4 mm Isolated Shower
02/10/2021 32.1 mm Thunderstorm; Hail
03/10/2021 69.5 mm Thunderstorm; Hail
05/10/2021 2.4 mm P.M. Isolated Thunderstorm
06/10/2021 3.0 mm A.M. Isolated Thunderstorm
07/10/2021 1.2 mm Isolated Showers
08/10/2021 2.1 mm Isolated Showers
09/10/2021 0.3 mm Isolated Showers
10/10/2021 3.7 mm Isolated Showers; Distant Thunder
12/10/2021 0.4 mm Isolated Showers
14/10/2021 34.5 mm Steady Rain; Thunder
15/10/2021 0.5 mm Isolated Showers
16/10/2021 0.2 mm Light Rain
18/10/2021 1.0 mm Isolated Showers; Distant Thunder
25/10/2021 24.1 mm P.M. Steady Rain; Thunder
26/10/2021 39.7 mm A.M. Steady Rain; Thunder; P.M. Showers
27/10/2021 11.9 mm Showers
28/10/2021 2.8 mm Isolated Showers
29/10/2021 4.6 mm Light Rain
30/10/2021 0.3 mm Light Rain
31/10/2021 6.7 mm Light Rain; P.M. Steady Rain
01/11/2021 19.9 mm Thunderstorm
08/11/2021 0.3 mm Light Rain
09/11/2021 2.8 mm Showers
11/11/2021 48.8 mm Heavy Thunderstorm; Hail
15/11/2021 2.5 mm Isolated Shower
22/11/2021 2.8 mm Showers; Distant Thunder
25/11/2021 61.3 mm Heavy Thunderstorm; Hail
27/11/2021 3.3 mm Showers; Distant Thunder
28/11/2021 30.7 mm Steady Rain; Thunder
29/11/2021 4.1 mm Showers
30/11/2021 1.0 mm Isolated Shower
02/12/2021 0.3 mm Light Rain
03/12/2021 29.9 mm Steady Rain; Distant Thunder
04/12/2021 2.4 mm Showers
05/12/2021 1.5 mm Isolated Showers
06/12/2021 4.3 mm Showers; Hail
09/12/2021 3.1 mm Isolated Showers; Hail
10/12/2021 0.3 mm Light Rain
11/12/2021 16.4 mm Intermittent Light Rain; Hail
12/12/2021 0.3 mm Light Rain
16/12/2021 2.8 mm Isolated Showers
23/12/2021 0.5 mm Light Rain
28/12/2021 0.3 mm Light Rain


2021 Compared to the Climate Means

  Climate Mean 2021 Anomaly
Mean Maximum Temperature 20.8°C 23.0°C +2.2°C
Mean Minimum Temperature 15.6°C 16.7°C +1.1°C
Mean Temperature 18.2°C 19.8°C +1.6°C
Mean Relative Humidity 76% 74.1% -1.9%
Mean Atmospheric Pressure 1016.5hPa 1018.6hPa +2.1hPa
Mean Wind Speed 16.4 km/h 17.3 km/h +0.9 km/h
Most Frequent Wind Direction West Northwest Northwest +22.5°
Total Rainfall 585.6 mm 558.0 mm -27.6 mm
Total Rain Days 84 days 80 days -4 days
Total Thunderstorm Days 26 days 27 days +1 day
Total Hail Days 8 days 13 days +5 days


Month-by-Month Summary for 2021

January 2021 – Warmer and Drier (REGISTERS WARMEST EVER JANUARY DAY)

February 2021 – Warmer and Drier (AMONG THE DRIEST ON RECORD)

March 2021 – Cooler and Drier

April 2021 – Cooler and Drier

May 2021 – Warmer and Drier

June 2021 – Warmer and Drier (THIRD HOTTEST ON RECORD)

July 2021 – Warmer with Average Rainfall

August 2021 – Warmer and Drier

September 2021 – Warmer and Drier

October 2021 – Cooler and Wetter (AMONG THE WETTEST ON RECORD)

November 2021 – Warmer and Wetter

December 2021 – Cooler and Drier


2021: A Year of Meteorological Extremes

2021 was an eventful year. It was a year of extremes.

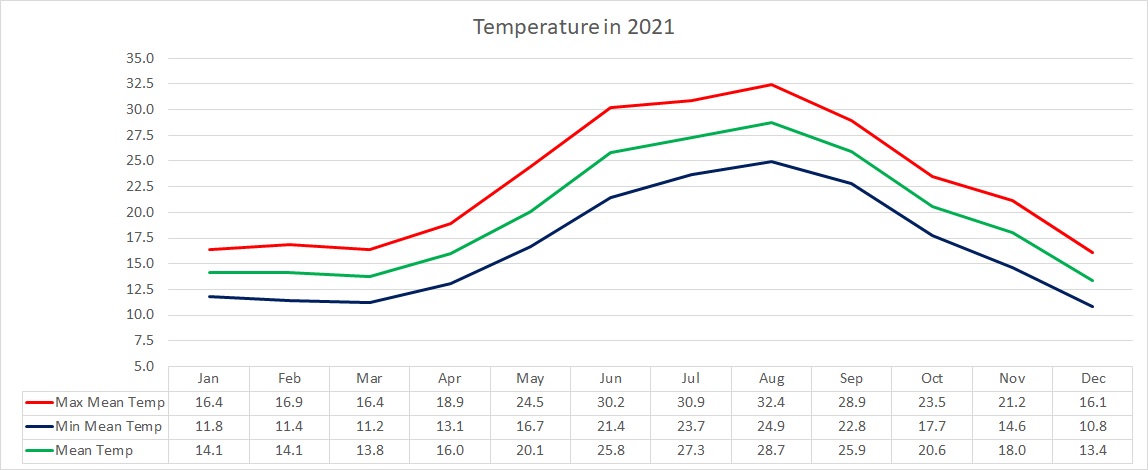
2021 was warmer than normal. With a mean temperature of 19.8˚C, the annual average was exceeded by 1.6˚C. The greatest difference from the climate mean was recorded in maximum temperatures. The months of March, April, October and December were the only ones with temperatures below the norm. A number of temperature-related records were broken over the course of last year. Saturday 9th January, on the second weekend of 2021, broke Malta’s national record for the warmest temperature ever measured in January. A very warm air mass advecting across the central Mediterranean from the Sahara Desert caused the temperature at our weather station in Għarb to shoot up to 23.6°C. An even warmer value of 25.8°C was measured at the airport in Luqa. That same day also broke the record for the warmest January night ever. The minimum air temperature that day dipped to only 17.1°C. The corresponding value at the airport in Luqa was of 19.4°C. More records were to fall in June. With a monthly average temperature of 25.8°C, June 2021 was a solid 2.0°C hotter than the climate norm. It was also the third hottest June on record in the Maltese Islands. Only those of 2019 and 2003 were hotter. A heat wave that characterized the meteorological scene in June broke records as well. Lasting from 20th June through to 30th June (both days included), it ended up being the longest heatwave experienced locally. The previous record of 10 days was set in August 2017. The heat wave’s final day, 30th June, was to break the record for the hottest June day ever. The temperature at our weather station in Għarb soared to 40.8°C on that day. An even higher value of 41.5°C was recorded at Malta International Airport. This heatwave occurred as a result of a heat dome. A heat dome is a phenomenon in which high-pressure atmospheric conditions trap air coming in from the Sahara Desert. The trapped air heats up at an alarming rate as it is compressed, like what happens under the lid on a saucepan. In normal conditions, winds are able to move a heat dome around, but because this particular heat dome stretched high into the atmosphere, it wasn’t easy to move about. This led to the persistent heatwave. The heat dome caused air pollution, desert sand and moisture to become stagnant, leading to a choked up atmosphere.

The coldest night of 2021 came in mid-February. The thermometer dipped to a chilly 5.9˚C on 15th February. This was during one of two brief cold snaps experienced in 2021.

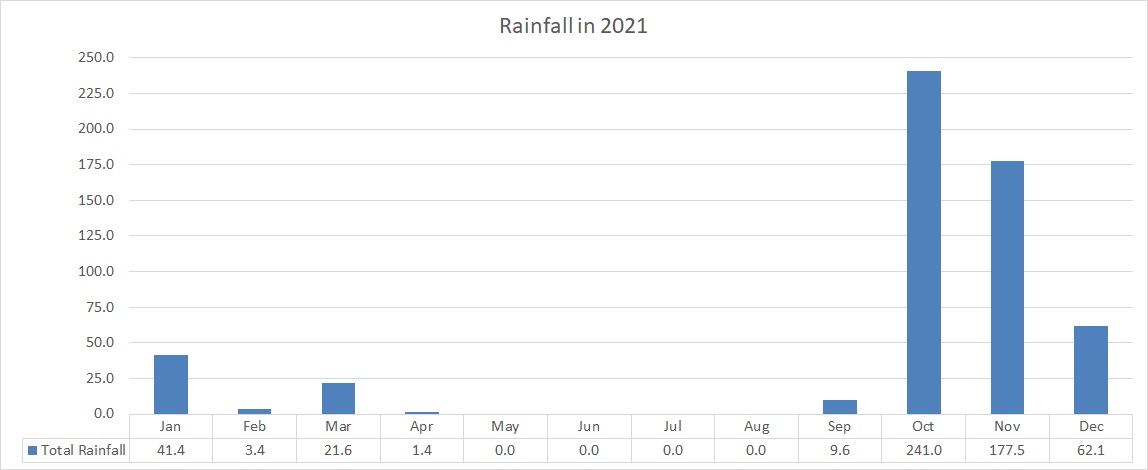
2021 was a an average year in terms of rainfall when viewed overall. A total of 558 mm was measured. That is only marginally below the climate average. More records were to be broken where rainfall is concerned. Rainfall was below average in a staggering ten months. Only 77.4 mm (or just under 14%) of the total rainfall in 2021 was measured over the course of the first nine months. Rain particularly scarce in February 2021. In fact, it was among the driest ever Februaries. Some places around the Maltese Islands did not see a drop of rain from 5th April through to 4th September 2021. No rain was registered in a number of localities for a total of 151 consecutive days. The months of October and November accounted for three quarters (or 428.1 mm) of the total rainfall measured throughout the entire year. October 2021, by far last year’s wettest month, became the third wettest October since record keeping began a century earlier. From early October 2021 throughout to mid-December 2021, the Maltese Islands experienced frequent rainy episodes (43 days of rain), with at least eight of these being events of very heavy rainfall. A handful of storms dumped in excess of 100 mm of rain over a number of localities. The ones which struck in the early hours of 3rd October, 11th November and 25th November were particularly dangerous. Cars were carried away by flash floods, and people had to be rescued from the flooding. The autumn of 2021 was the wettest in over 20 years. The very warm sea that surrounded the Maltese Islands after the very warm summer played an important part in creating an excessively wet autumn. As summer transitioned into autumn, cooler air from over Europe started infiltrating the central Mediterranean. The sharp difference between local and incoming air greatly destabilized the atmosphere above the Maltese Islands, leading to the formation of successive vigorous bad weather systems. In addition to this, a greater amount of moisture was available to be advected into these systems as a result of the very warm sea, leading to larger amounts of rainfall.

Averaging at 17.3 km/h, the wind was marginally stronger than in a typical year. The highest gust last year was registered at 78.9km/h from the Northwest, during a gale on 7th February.

Overall, the average atmospheric pressure was slightly higher than the norm. The first half of the year was dotted by a series of blocking anticyclones. These are areas of high pressure that remain stationary over an area for several weeks. Bringing long days of uninterrupted bright sunshine, these anticyclones were responsible for the dry weather experienced at the start of 2021. The highest value of atmospheric pressure was recorded on the 23rd of February. It reached 1035.2hPa. The lowest value of atmospheric pressure registered, on the other hand, was on 21st March. It dropped to 998.3hPa, as an intense low pressure system traversed the central Mediterranean.
 

End of Month Reports

The Two Faces of December 2021

Air Temperature

Highest Maximum 18.9°C 2nd
Lowest Maximum 12.6°C 19th
Highest Minimum 14.9°C 2nd 
Lowest Minimum 6.4°C 16th


Mean Maximum 16.1°C
Mean Minimum 10.8°C
Mean 13.4°C


Relative Humidity

Lowest Relative Humidity 41% 18th


Mean Relative Humidity 77.5%


Atmospheric Pressure

Highest Atmospheric Pressure 1027.2hPa 17th
Lowest Atmospheric Pressure 1004.3hPa 6th


Mean Atmospheric Pressure 1017.4hPa


Wind

Highest Gust 66.0km/h 11th


Mean Wind Speed 14.4km/h
Most Frequent Wind Direction Northwest


Precipitation

Total Rainfall During December 2021 62.1 mm
Total Rainfall Since Last 01/09 490.2 mm


Highest 24 Hour Total 29.9 mm 3rd


Rain Days 12 days
Thunderstorm Days 1 day
Hail Days 2 days


Rainfall Events

02/12/2021 0.3 mm Light Rain
03/12/2021 29.9 mm Steady Rain; Distant Thunder
04/12/2021 2.4 mm Showers
05/12/2021 1.5 mm Isolated Showers
06/12/2021 4.3 mm Showers; Hail
09/12/2021 3.1 mm Isolated Showers; Hail
10/12/2021 0.3 mm Light Rain
11/12/2021 16.4 mm Intermittent Light Rain; Hail
12/12/2021 0.3 mm Light Rain
16/12/2021 2.8 mm Isolated Showers
23/12/2021 0.5 mm Light Rain
28/12/2021 0.3 mm Light Rain


December 2021 Compared to the Climate Means

  Climate Mean December 2021 Anomaly
Mean Maximum Temperature 17.6°C 16.1°C -1.5°C
Mean Minimum Temperature 11.8°C 10.8°C -1.0°C
Mean Temperature 14.5°C 13.4°C -1.1°C
Mean Relative Humidity 79% 77.5% -1.5%
Mean Atmospheric Pressure 1017.3hPa 1017.4hPa +0.1hPa
Mean Wind Speed 18.2 km/h 14.4 km/h -3.8km/h
Total Rainfall 109.7 mm 62.1 mm -47.6 mm
Total Rainfall Since Last 01/09 342.1 mm 490.2 mm +147.9 mm
Total Rain Days 14 days 12 days -2 days
Total Thunderstorm Days 4 days 1 day -3 days
Total Hail Days 1 day 2 days +1 day


The Two Faces of December 2021

The first half of December 2021 was characterized by frequent rainy episodes. Almost all of last month’s 62.1 mm of rain were measured on ten days of rain in the first half of the month. The meteorological situation changed almost like a switch midway through. The second half of December 2021 was characterized by largely dry weather conditions. This abrupt change in the meteorological situation may be attributed to the expansion of a blocking anticyclone across the western Mediterranean. This continued to expand and strengthen across mainland Europe too at the end of the month. This ensured fine weather for the Maltese Islands, as the incoming storm systems were deviated to the north. In a stark contrast to October 2021 and November 2021, last month registered just over a half of the climatic average in terms of rain.

Overall, where temperature is concerned, December 2021 turned out to be markedly colder than the climate norm. In fact, last months mean temperature of 13.4°C was a solid 1.1°C colder than that of a typical December. An episode of wintry temperatures halfway through the month contributed to this. Minimum temperatures dipped to below 10°C on a total of 13 nights. Last month’s coldest minimum of 6.4°C was  in the early hours of Thursday 16th. The coldest day overall was Sunday 19th with maximum and minimum temperatures of 12.6°C and 7.4°C respectively. Conversely, the days around Christmas and New Year’s were characterized by very warm temperatures that were advected from the Sahara Desert across to parts of the Mediterranean and western Europe.

Wind behavior also reflected the switch in atmospheric pressure patterns halfway through the month. The first half of December 2021 was notably windy, with no less than three gales being registered. The second half of last month was much calmer, as a blocking anticyclone ensured stability across the region.


Rainfall Totals around the Maltese Islands in December 2021 (and since last September 1st):

Għarb: 62.1 mm (490.2 mm)

Marsalforn: 49.5 mm (545.9 mm)

Victoria: 60.4 mm (503.5 mm)

Xewkija: 32.0 (468.4 mm)

Nadur: 49.8 mm (532.4 mm)

Mellieħa: 45.4 mm (476.4 mm)

Buġibba: 36.2 mm (507.9 mm)

Naxxar: 35.4 mm (492.5 mm)

Dingli: 32.1 mm (393.9 mm)

Mġarr: 34.3 mm (478.2 mm)

Mosta: 45.3 mm (399.9 mm)

Msida: 52.2 mm (478.6 mm)

Sliema: 50.1 mm (464.4 mm)

Valletta: 28.8 mm (306.2 mm)

Imqabba: 26.6 mm (446.9 mm)

Żabbar: 44.0 mm (511.6 mm)

Birżebbuġa: 26.2 mm (356.1 mm)

NATIONAL MEAN: 41.8 mm (461.9 mm)

End of Month Reports

Wetter than Average Autumn continues in November 2021

Air Temperature

Highest Maximum 25.9°C 6th
Lowest Maximum 14.8°C 30th
Highest Minimum 21.3°C 7th 
Lowest Minimum 9.9°C 29th


Mean Maximum 21.2°C
Mean Minimum 14.6°C
Mean 18.0°C


Relative Humidity

Lowest Relative Humidity 49% 6th


Mean Relative Humidity 80.9%


Atmospheric Pressure

Highest Atmospheric Pressure 1025.3hPa 19th
Lowest Atmospheric Pressure 1003.1hPa 28th


Mean Atmospheric Pressure 1014.6hPa


Wind

Highest Gust 61.2km/h 29th


Mean Wind Speed 13.4km/h
Most Frequent Wind Direction Southeast


Precipitation

Total Rainfall During November 2021 177.5 mm
Total Rainfall Since Last 01/09 428.1 mm


Highest 24 Hour Total 61.3 mm 25th


Rain Days 11 days
Thunderstorm Days 6 days
Hail Days 2 days


Rainfall Events


01/11/2021 19.9 mm Thunderstorm
08/11/2021 0.3 mm Light Rain
09/11/2021 2.8 mm Showers
11/11/2021 48.8 mm Heavy Thunderstorms; Hail
15/11/2021 2.5 mm Isolated Shower
22/11/2021 2.8 mm Showers; Distant Thunder
25/11/2021 61.3 mm Heavy Thunderstorm; Hail
27/11/2021 3.3 mm Showers; Distant Thunder
28/11/2021 30.7 mm Steady Rain; Thunder
29/11/2021 4.1 mm Showers
30/11/2021 1.0 mm Isolated Shower


November 2021 Compared to the Climate Means

  Climate Mean November 2021 Anomaly
Mean Maximum Temperature 20.6°C 21.2°C +0.6°C
Mean Minimum Temperature 14.5°C 14.6°C +0.1°C
Mean Temperature 17.6°C 18.0°C +0.4°C
Mean Relative Humidity 77% 80.9% +3.9%
Mean Atmospheric Pressure 1017.9hPa 1014.6hPa -3.3hPa
Mean Wind Speed 16.3 km/h 13.4 km/h -2.9km/h
Total Rainfall 93.6 mm 177.5 mm +83.9 mm
Total Rainfall Since Last 01/09 232.4 mm 428.1 mm +195.7 mm
Total Rain Days 11 days 11 days /
Total Thunderstorm Days 4 days 6 days +2 days
Total Hail Days 1 day 2 days +1 day


Wetter than Average Autumn continues in November 2021

The wetter than average trend set earlier in autumn was maintained throughout the month of November 2021. A total of 177.5 mm of rain was measured by our weather station. This is almost double the climate norm of 93.6 mm. This year’s autumn is the wettest in years, and has helped relieve the drought that had gripped the Maltese Islands in previous years. This didn’t come without any consequences, unfortunately. The bulk of the rain came from rainfall events that dotted the second half of the month. There were 11 days of rain last month. 2 of these were severe rainfall events. The thunderstorms of 11th and 25th November both struck in the early hours. They each dumped in excess of 100 mm of rain over several localities, sparking flash floods. The one on the 25th was particularly dangerous, with a number of people having to be rescued from the flooding. Total rainfall since last September 1st now stands at 428.1 mm. That is more than what was measured throughout the 2020/2021 rainfall season.

With regards to temperature, November 2021 turned out to be marginally warmer, especially where daytime maximum temperatures are concerned. This is mainly due to a spell of balmy temperatures that lasted much of the first half of the month. Winds from the south fanned warm air from the Sahara Desert across the central Mediterranean, elevating temperatures to well above average. The return of the westerlies brought colder temperatures towards the end of the month. Last month’s mean temperature of 18.0°C was 0.4°C warmer than what one would expect in a typical November.

Rainfall Totals around the Maltese Islands in November 2021 (and since last September 1st):

Għarb – 177.5 mm (428.1 mm)

Marsalforn – 221.9 mm (496.4 mm)

Victoria – 171.2 mm (443.1 mm)

Xewkija – 216.0 mm (436.4 mm)

Nadur – 233.5 mm (482.5 mm)

Mellieħa – 236.8 mm (431.0 mm)

Buġibba – 230.2 (471.7 mm)

Naxxar – 225.8 mm (457.1 mm)

Dingli – 130.1 mm (361.8 mm)

Mġarr – 191.7 mm (443.9 mm)

Mosta – 164.1 mm (354.6 mm)

Msida – 176.2 mm (426.4 mm)

Sliema – 175.4 mm (414.3 mm)

Valletta – 115.8mm (277.4 mm)

Imqabba – 144.2 mm (420.3 mm)

Żabbar – 174.9 mm (467.4 mm)

Birżebbuġa – 105.6 mm (329.9 mm)

NATIONAL MEAN – 181.1 mm (420.3 mm)

Severe Weather Reports

Squall Line on 11/11/2021

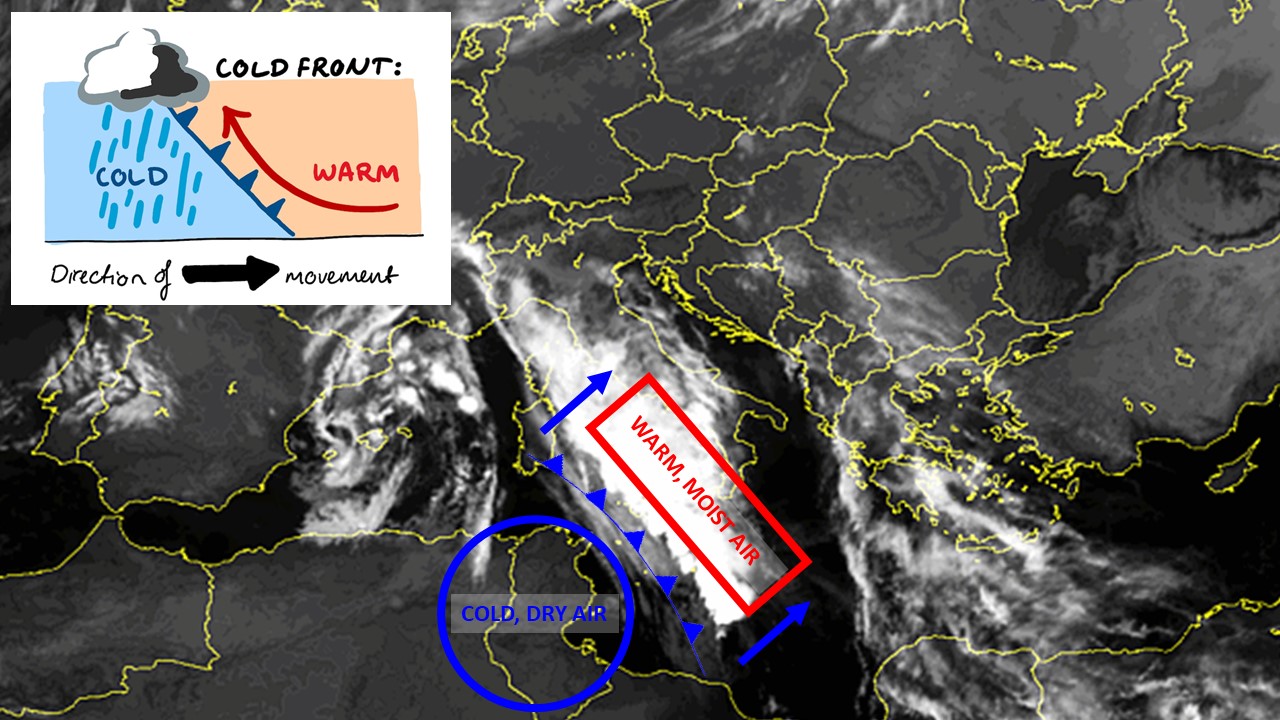
A highly unstable cold front associated with an intense low pressure over northern Algeria traversed the central Mediterranean in the very early hours of Thursday 11th November. This produced heavy thunderstorms across the Maltese Islands. Gozo bore the brunt of the stormy weather. 115.3 mm of rain were measured in Għajnsielem, the hardest hit locality. Several other localities in Gozo measured around 100 mm of precipitation. That is just over a month’s worth of rainfall. This fell in a matter of just over an hour. The wind experienced a sudden shift to the West as soon as the thunderstorm made landfall. Gusts of up to 70 km/h were recorded by exposed weather stations around the Maltese Islands. Valley systems burst and roads flooded. There were collapsed rubble walls and downed power lines.

What is a cold front? A cold front develops when a mass of comparatively colder air moves into an area where warmer air is present. In our case, a southerly wind had been advecting very warm air across the central Mediterranean for days. This warm air was constantly picking up moisture from the very warm sea locally. This caused the atmosphere above our region to become saturated. This was evident from the episodes of misty weather that had characterized our meteorological scene for days on end. An outbreak of colder air that had penetrated the Mediterranean earlier in the week reached the Maltese Islands late on Wednesday 10th November. Drier, colder air pushes the warmer, moister air upwards. This forces the rising air to cool rapidly. As the moisture-laden air cools, the water vapor within condenses, forming rain-bearing clouds. The greater the contrast between the two, the more intense the rain-bearing clouds that form are. The chart below is a simplified representation of what happens at a cold front.

What type of thunderstorm was it? There are four main types of thunderstorms: single-cell, multi-cell, squall line and supercell. Which type forms is dependent on atmospheric conditions, namely instability and wind shear (wind conditions at different layers of the atmosphere), at the time. In our case, we experienced a squall line. A squall is defined as an elongated and narrow line of thunderstorms that form along a cold front. A squall line is typically with a brief but extremely intense episode of torrential precipitation, hail, incessant lightning and damaging wind gusts. When wind in the upper levels of atmosphere is relatively weak, squall lines move more slowly, exacerbating their impact on affected areas. Since a squall line is comprised of multiple small cells of thunderstorms, it is difficult to predict which localities will be hit worst well in advance.

Video: Terence Farrugia

Video: Michael Vella

End of Month Reports

Warmer and Drier September 2021

Air Temperature

Highest Maximum 31.9°C 18th
Lowest Maximum 27.1°C 9th
Highest Minimum 26.0°C 18th 
Lowest Minimum 18.5°C 8th


Mean Maximum 28.9°C
Mean Minimum 22.8°C
Mean 25.9°C


Relative Humidity

Lowest Relative Humidity 47% 15th


Mean Relative Humidity 77.7%


Atmospheric Pressure

Highest Atmospheric Pressure 1023.2hPa 26th
Lowest Atmospheric Pressure 1012.5hPa 12th


Mean Atmospheric Pressure 1017.8hPa


Wind

Highest Gust 43.5km/h 11th


Mean Wind Speed 5.4km/h
Mean Gust Speed 13.3km/h
Mean Wind + Gust Speed 9.3km/h spójrz tutaj
Most Frequent Wind Direction North Northwest


Precipitation

Total Rainfall During September 2021 9.6 mm
Total Rainfall Since Last 01/09 9.6 mm


Highest 24 Hour Total 3.6 mm 4th


Rain Days 5 days
Thunderstorm Days 4 days
Hail Days 0 days


Rainfall Events

04/09/2021 3.6 mm Thunderstorm
06/09/2021 1.5 mm Isolated Thunderstorm
09/09/2021 2.6 mm Isolated Shower; Distant Thunder
10/09/2021 1.5 mm Isolated Shower; Distant Thunder
11/09/2021 0.4 mm Isolated Shower


September 2021 Compared to the Climate Means

  Climate Mean September 2021 Anomaly
Mean Maximum Temperature 28.3°C 28.9°C +0.6°C
Mean Minimum Temperature 20.8°C 22.8°C +2.0°C
Mean Temperature 24.6°C 25.9°C +1.3°C
Mean Relative Humidity 77% 77.7% +0.7%
Mean Atmospheric Pressure 1017.4hPa 1017.8hPa +0.4hPa
Mean Wind Speed 13.7 km/h 9.3 km/h -4.4km/h
Total Rainfall 55.5 mm 9.6 mm -45.9 mm
Total Rainfall Since Last 01/09 55.5 mm 9.6 mm -45.9 mm
Total Rain Days 4 days 5 days +1 day
Total Thunderstorm Days 3 days 4 days +1 day
Total Hail Days 1 day 0 days -1 day


Warmer and Drier in September 2021

Overall, October 2021 turned out to be significantly warmer than the climate norm. At 25.9°C, temperatures were 1.3°C warmer than the mean. Temperatures were above average on 19 days. This may be attributed to the central Mediterranean being covered by a persistent north African high pressure system. This fanned hot air from the Sahara Desert towards our region, maintaining air temperatures at an elevated level. The hottest day last month was on the 18th, when the mercury spiked to 31.9°C.

September 2021 was also drier than average. The 9.6 mm of rain measured last month all fell in the first week. This accounted for far less than a quarter of the climate mean. This was the result of anticyclonic conditions that prevailed over the central Mediterranean for a large part of the month. These acted as a barrier, which prevented low pressure systems from reaching the central Mediterranean.

The more stable meteorological conditions also meant weaker winds.


Rainfall Totals around the Maltese Islands in September 2021 (and since last September 1st):

Għarb – 9.6 mm (9.6 mm)

Marsalforn – 15.2 mm (15.2 mm)

Victoria – 18.4 mm (18.4 mm)

Xewkija – 14.8 mm (14.8 mm)

Nadur – 12.9 mm (12.9 mm)

Mellieħa – 16.8 mm (16.8 mm)

Buġibba – 34.3 (34.3 mm)

Naxxar – 34.3 mm (34.3 mm)

Dingli – 46.2 mm (46.2 mm)

Mġarr – 25.9 mm (25.9 mm)

Mosta – 25.0 mm (25.0 mm)

Msida – 22.8 mm (22.8 mm)

Sliema – 25.4 mm (25.4 mm)

Valletta – 21.1mm (21.1 mm)

Imqabba – 13.3 mm (13.3 mm)

Żabbar – 12.5 mm (12.5 mm)

Birżebbuġa – 12.1 mm (12.1 mm)

NATIONAL MEAN – 21.2 mm (21.2 mm)

End of Month Reports

October 2021 One of the Wettest Ever

Air Temperature

Highest Maximum 27.6°C 4th and 5th
Lowest Maximum 18.4°C 29th
Highest Minimum 21.4°C 1st 
Lowest Minimum 13.9°C 21st


Mean Maximum 23.5°C
Mean Minimum 17.7°C
Mean 20.6°C


Relative Humidity

Lowest Relative Humidity 48% 15th


Mean Relative Humidity 78.0%


Atmospheric Pressure

Highest Atmospheric Pressure 1029.6hPa 20th
Lowest Atmospheric Pressure 1008.0hPa 14th


Mean Atmospheric Pressure 1017.3hPa


Wind

Highest Gust 49.9km/h 16th


Mean Wind Speed 7.2km/h
Mean Gust Speed 16.8km/h
Mean Wind + Gust Speed 11.6km/h
Most Frequent Wind Direction South Southeast


Precipitation

Total Rainfall During October 2021 241.0 mm
Total Rainfall Since Last 01/09 250.6 mm


Highest 24 Hour Total 69.5 mm 3rd


Rain Days 20 days
Thunderstorm Days 10 days
Hail Days 2 days


Rainfall Events

02/10/2021 32.1 mm Thunderstorm; Hail
03/10/2021 69.5 mm Thunderstorm; Hail
05/10/2021 2.4 mm P.M. Isolated Thunderstorm
06/10/2021 3.0 mm A.M. Isolated Thunderstorm
07/10/2021 1.2 mm Isolated Showers
08/10/2021 2.1 mm Isolated Showers
09/10/2021 0.3 mm Isolated Showers
10/10/2021 3.7 mm Isolated Showers; Distant Thunder
12/10/2021 0.4 mm Isolated Showers
14/10/2021 34.5 mm Steady Rain; Thunder
15/10/2021 0.5 mm Isolated Showers
16/10/2021 0.2 mm Light Rain
18/10/2021 1.0 mm Isolated Showers; Distant Thunder
25/10/2021 24.1 mm P.M. Steady Rain; Thunder
26/10/2021 39.7 mm A.M. Steady Rain; Thunder; P.M. Showers
27/10/2021 11.9 mm Showers
28/10/2021 2.8 mm Showers
29/10/2021 4.6 mm Light Rain
30/10/2021 0.3 mm Light Rain
31/10/2021 6.7 mm Light Rain; P.M. Steady Rain


October 2021 Compared to the Climate Means

  Climate Mean October 2021 Anomaly
Mean Maximum Temperature 24.8°C 23.5°C -1.3°C
Mean Minimum Temperature 17.9°C 17.7°C -0.2°C
Mean Temperature 21.4°C 20.6°C -0.8°C
Mean Relative Humidity 78% 78.0% /
Mean Atmospheric Pressure 1017.6hPa 1017.3hPa -0.3hPa
Mean Wind Speed 14.1 km/h 11.6 km/h -2.5km/h
Total Rainfall 83.3 mm 241.0 mm +157.7 mm
Total Rainfall Since Last 01/09 138.8 mm 250.6 mm +111.8 mm
Total Rain Days 10 days 20 days +10 days
Total Thunderstorm Days 5 days 10 days +5 days
Total Hail Days 1 day 2 days + 1 day


October 2021 One of the Wettest Ever

October 2021 turned out to be noticeably cooler than average. With a mean temperature of 20.6°C, last month was a solid 0.8°C cooler than the climate norm. Last month started off on a relatively warm note. This was short-lived, however. Successive pockets of cooler air from over Europe, coupled with the cooling effect of rain on a staggering 20 days, ensured a pattern of consistently cooler than average temperatures. A 13.9°C low, the coldest for October 2021, was registered on the 21st. This was measured at around dawn, after a night of cooling under anticyclonic conditions. The very warm days at the start of the month were brought about by southerly winds which fanned hot air from north Africa towards the central Mediterranean. Last months warmest temperature of 27.6°C was measured on two days, the 4th and 5th.

The 241.0 mm of rain measured last month was almost three times more than the 83.3 mm expected in a typical October. This made October 2021 the third wettest October since record keeping began a century ago. Rain fell on 20 days last month, with rainfall events having been evenly distributed, bar for a brief dry spell in the third week of the month. Thunder was heard on 10 days. Hail was observed on 2 days. Total 24-hour rainfall exceeded 25 mm on 4 days. The wettest day was the 3rd, when 69.5 mm of rain were recorded. Much of this rain fell in a few minutes in the very early hours, during an intense thunderstorm that packed rainfall rates of over 300 mm/hr, winds of up to Force 7 and dangerous cloud-to-ground lightning. Xlendi, notable for frequent in storms, bore the brunt of it all. The valley system that empties in Xlendi collects run-off from the localities which received the most rainfall from these thunderstorms. Cars were carried to the sea and debris littered the streets. Rainfall during the thunderstorm was most intense between 3:28 a.m. and 3:39 a.m. when a staggering 37.8 mm of rain were dumped in just 11 minutes.


Rainfall Totals around the Maltese Islands in October 2021 (and since last September 1st):

Għarb – 241.0 mm (250.6 mm)

Marsalforn – 259.3 mm (274.5 mm)

Victoria – 253.5 mm (271.9 mm)

Xewkija – 205.6 mm (220.4 mm)

Nadur – 236.1 mm (249.0 mm)

Mellieħa – 177.4 mm (194.2 mm)

Buġibba – 207.2 mm (241.5 mm)

Naxxar – 197.0 mm (231.3 mm)

Dingli – 185.5 mm (231.7 mm)

Mġarr – 226.3 mm (252.2 mm)

Mosta – 165.5 mm (190.5 mm)

Msida – 227.4 mm (250.2 mm)

Sliema – 213.5 mm (238.9 mm)

Valletta – 140.5 mm (161.6 mm)

Imqabba – 262.8 mm (276.1 mm)

Żabbar – 292.5 mm (305.1 mm)

Birżebbuġa – 212.2 mm (224.3 mm)

NATIONAL MEAN – 218.0 mm (239.2 mm)

Severe Weather Reports

Heavy Thunderstorms on 2&3/10/2021

The sea surface temperature around the Maltese Islands this summer peaked at 30⁰C, a full 3⁰C warmer than the average. The high sea surface temperature contributed to increased rates of evaporation, which in turn, lead to an increase in humidity levels. From 1/10 through to 3/10, a series of heavy thunderstorms occurred around the central Mediterranean. A short-wave upper-level low pressure system passed across our region bringing relatively cold air over a very warm sea, creating a great deal of instability. In addition to this, a greater amount of moisture was available to be advected into these thunderstorms. The end product were thunderstorms with intense rainfall.

Most thunderstorms were localized, affecting a few localities at a time. At least two main thunderstorms affected the Maltese Islands. The first came in the early hours of Saturday 2/10, whilst the second hit some 24 hours later, in the early hours of Sunday 3/10. Gozo got the most rainfall from both thunderstorms. The second thunderstorm was the more intense one. It packed rainfall rates of over 300 mm / hr, winds of up to Force 7 and dangerous cloud-to-ground lightning. The coastal town of Xlendi, notable for frequent flooding in storms, bore the brunt of it all. The valley system that empties in Xlendi collects run-off from the localities which received the most rainfall from these thunderstorms. Cars were carried to sea and debris littered the roads. Rainfall during the second thunderstorm was most intense between 3:28 a.m. and 3:39 a.m. when a staggering 37.8 mm of rain were dumped in just 11 minutes. The temperature dropped from 23.6°C to 17.9°C during the thunderstorm. The wind gusted up to 56.3 km/h. In addition to these two main storms, a few other showers and isolated thunderstorms also affected the islands over a period of some 48 hours. The absence of wind at the upper levels of the atmosphere meant that the entire zone of instability, along with all the individual thunderstorms within it were extremely slow-moving. This exacerbated further the amount of rainfall dumped by the storms. Below are values for total rainfall gathered in several localities around the Maltese Islands:

Għarb – 32.1 mm + 69.5 mm = 101.6 mm

Victoria – 26.3 mm + 59.7 mm = 66.0 mm

Xewkija – 21.8 mm + 37.4 mm = 59.2 mm

Nadur – 26.9 mm + 60.9 mm = 87.8 mm

Marsalforn – 38.1 mm + 55.5 mm = 93.6 mm

Mellieħa = 8.8 mm + 32.4 mm = 41.2 mm

Buġibba – 15.0 mm + 25.2 mm = 40.2 mm

Mġarr – 13.7 mm + 31.0 mm = 44.7 mm

Naxxar – 12.2 mm + 26.4 mm = 38.6 mm

Mosta – 9.8 mm + 14.7 mm = 24.5 mm

Dingli – 24.3 mm + 28.6 mm = 52.9 mm

Msida – 22.4 mm + 21.1 mm = 43.5 mm

Valletta – 19.8 mm + 23.6 mm = 43.4 mm

Sliema – 23.4 mm + 18.3 mm = 41.7 mm

Mqabba – 22.6 mm + 24.9 mm = 47.5 mm

Żabbar – 17.5 mm + 16.3 mm = 33.8 mm

Birżebbuġa – 12.2 mm + 12.0 mm = 24.2 mm

Thanks to these thunderstorms, the total rainfall all round the Maltese Islands for October 2020 is already more than half than the climate average for the same month.


A series of waterspouts were observed, particularly on Friday. These start their existence as a funnel cloud below a cumuliform cloud when a column of swirling air begins to rotate, causing the surrounding moisture to condense into water droplets. This vortex begins to move downward, creating a funnel shape which protrudes for a distance below the cloud. Often, it is too weak to extend all the way down and make contact with the ground. When it does manage contact with the ground, it takes the form of a weak waterspout or landspout. Most funnels which form locally are of this kind, and rarely of their stronger relatives, the tornadoes.