Hotter August 2020
Air Temperature
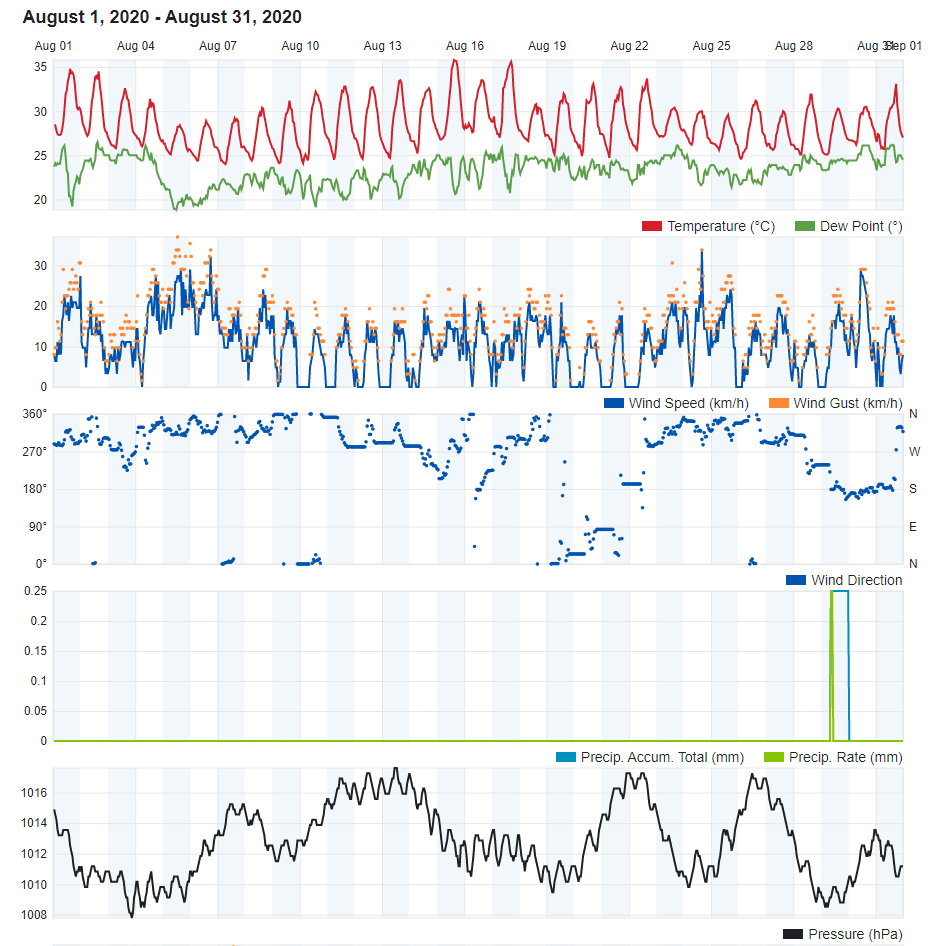
| Highest Maximum | 35.8°C | 15th |
| Lowest Maximum | 28.7°C | 5th |
| Highest Minimum | 26.3°C | 1st |
| Lowest Minimum | 22.6°C | 21st |
| Mean Maximum | 31.9°C |
| Mean Minimum | 24.3°C |
| Mean | 28.1°C |
Relative Humidity
| Highest Relative Humidity | 96% | 3rd, 4th and 5th |
| Lowest Relative Humidity | 20% | 31st |
| Mean Relative Humidity | 72.8% |
Atmospheric Pressure
| Highest Atmospheric Pressure | 1018.0hPa | 13th and 21st |
| Lowest Atmospheric Pressure | 1007.8hPa | 31st |
| Mean Atmospheric Pressure | 1013.1hPa |
Wind
| Highest Gust | 45.1km/h | 6th |
| Mean Wind Speed | 6.5km/h |
| Mean Gust Speed | 12.4km/h |
| Mean Wind + Gust Speed | 9.5km/h |
| Most Frequent Wind Direction | Northwest |
Precipitation
| Total Rainfall During August 2020 | 0.0 mm |
| Total Rainfall Since Last 01/09 | 406.1 mm |
| Highest 24 Hour Total | 0.0 mm |
| Rain Days https://southafrica-ed.com/kamagra-in-south-africa/ | 0 |
| Thunderstorm Days | 0 |
| Hail Days | 0 |
August 2020 Compared to the Climate Means
| Climate Mean | August 2020 | Anomaly | |
| Mean Maximum Temperature | 31.1°C | 31.9°C | +0.8°C |
| Mean Minimum Temperature | 22.9°C | 24.3°C | +1.4°C |
| Mean Temperature | 27.0°C | 28.1°C | +1.1°C |
| Mean Relative Humidity | 73% | 72.8% | -0.2% |
| Mean Atmospheric Pressure | 1015.4hPa | 1013.1hPa | -2.3hPa |
| Mean Wind Speed | 13.0 km/h | 9.5 km/h | -3.5km/h |
| Most Frequent Wind Direction | Northwest | Northwest | 0° |
| Total Rainfall | 7.9 mm | 0.0 mm | -7.9 mm |
| Total Rainfall Since Last 01/09 | 555.7 mm | 406.1 mm | -149.6 mm |
| Total Rain Days | 1 | 0 | -1 |
| Total Thunderstorm Days | 0 | 0 | 0 |
| Total Hail Days | 0 | 0 | 0 |
Hotter August 2020
August 2020 was the hottest month of the year. It was a staggering 1.4°C hotter than July, the second hottest month of 2020. The average temperature exceeded the climate norm by 1.1°C. The climate average was exceeded on a total of 25 out of 31 days. The maximum temperature for August was registered at the height of a heat spell which characterised much of the second and third week of August. The mercury on the 15th soared to 35.8°C. Nights offered litle relief throughout. With the exception of just one night (the 21st), the minimum temperature never dipped below the 23°C mark.
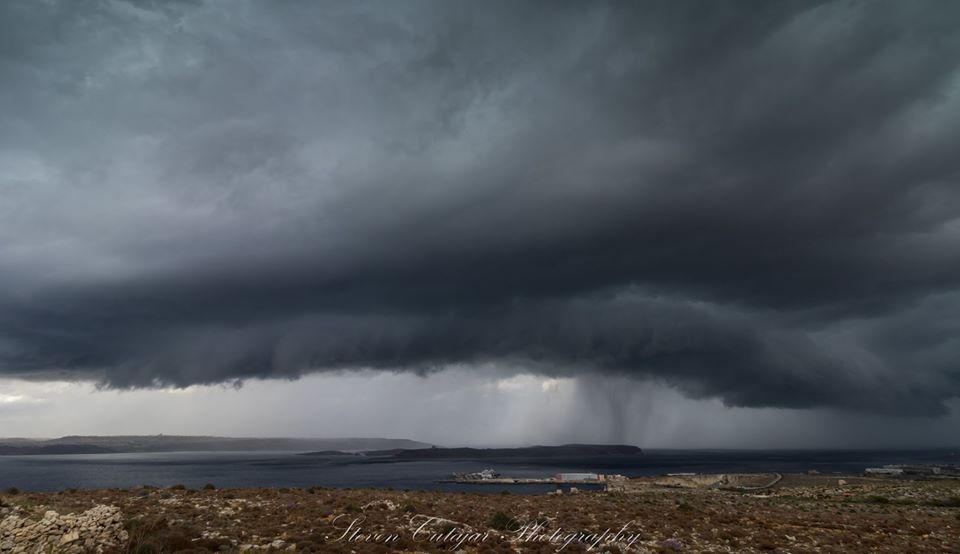
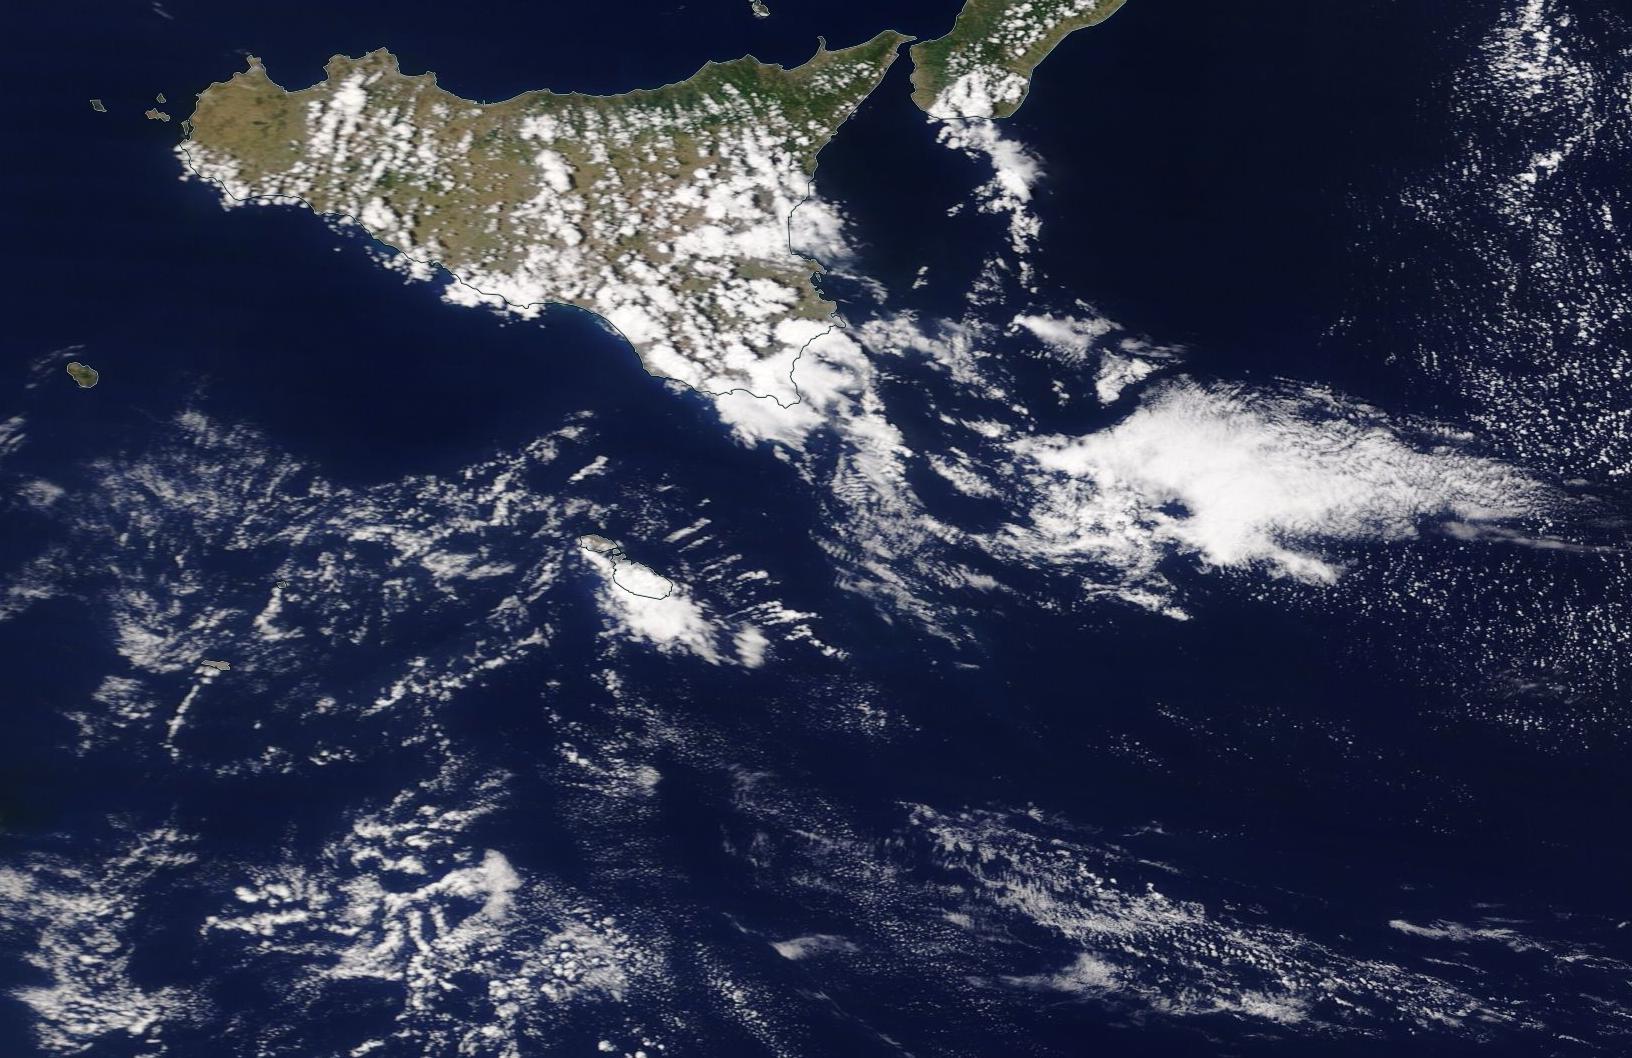
Our weather station in Għarb recorded no precipitation in August 2020, as rain clouds kept well away of the Maltese Islands. It is quite common to experience a completely dry August. In fact, six of the past ten years experienced a bone dry August. An interesting observation was the lack of cumulus clouds (locally referred to as the ‘għarixa’). These were only sparsely observed. This implies a lack of cool air aloft, a sure sign of a stable atmosphere.
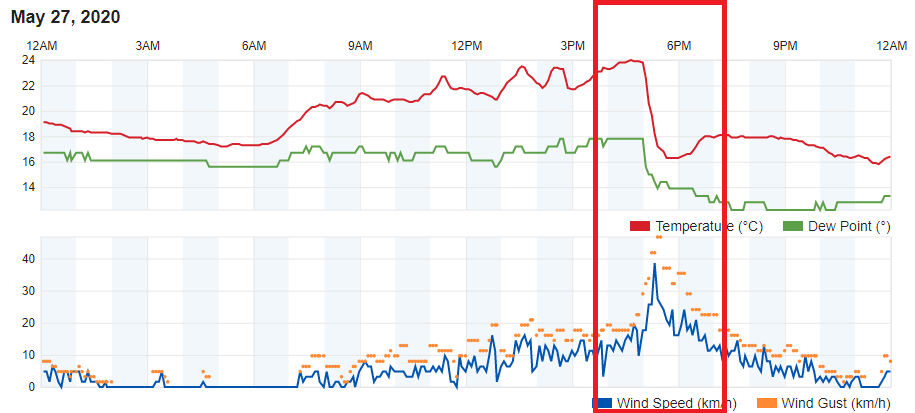
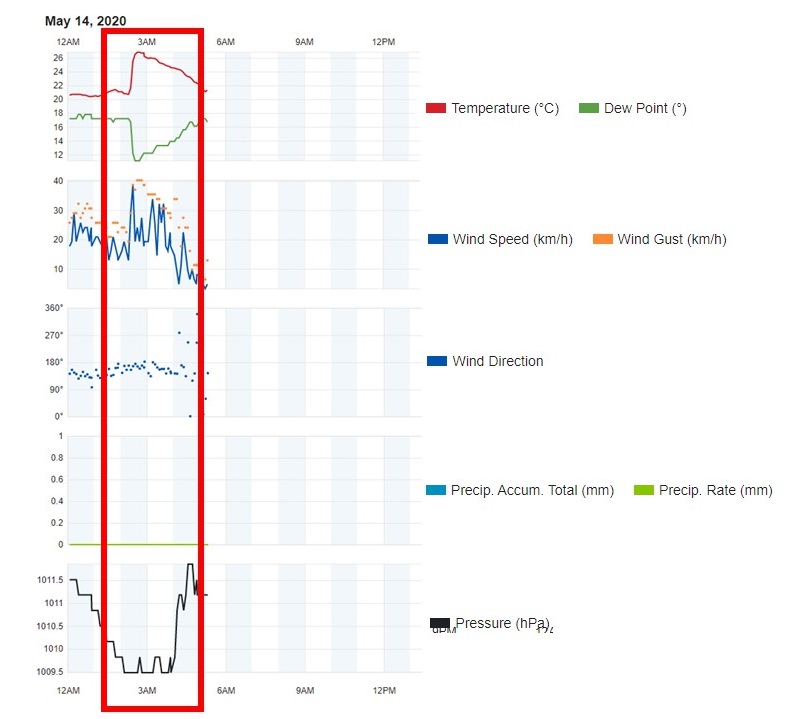
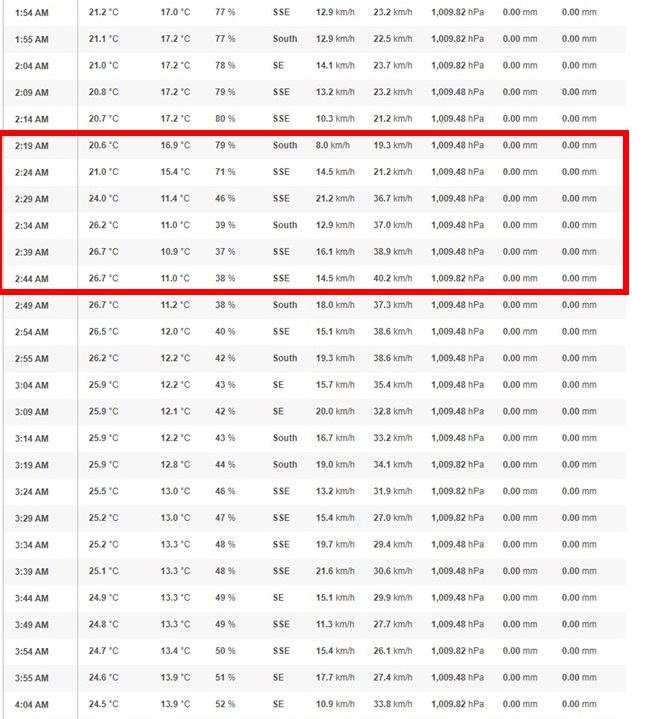
Overall, the wind was lighter than normal. The wind gusted up to Force 6 on just three days. All three were back-to-back (the 4th, 5th and 6th). The highest wind gust was registered at 45.1 km/h (Force 6), on the 6th. These three days were also the only three days with a maximum temperature below 30°C. This was due to a short-lived area of instability across the central Mediterranean.