
Air Temperature
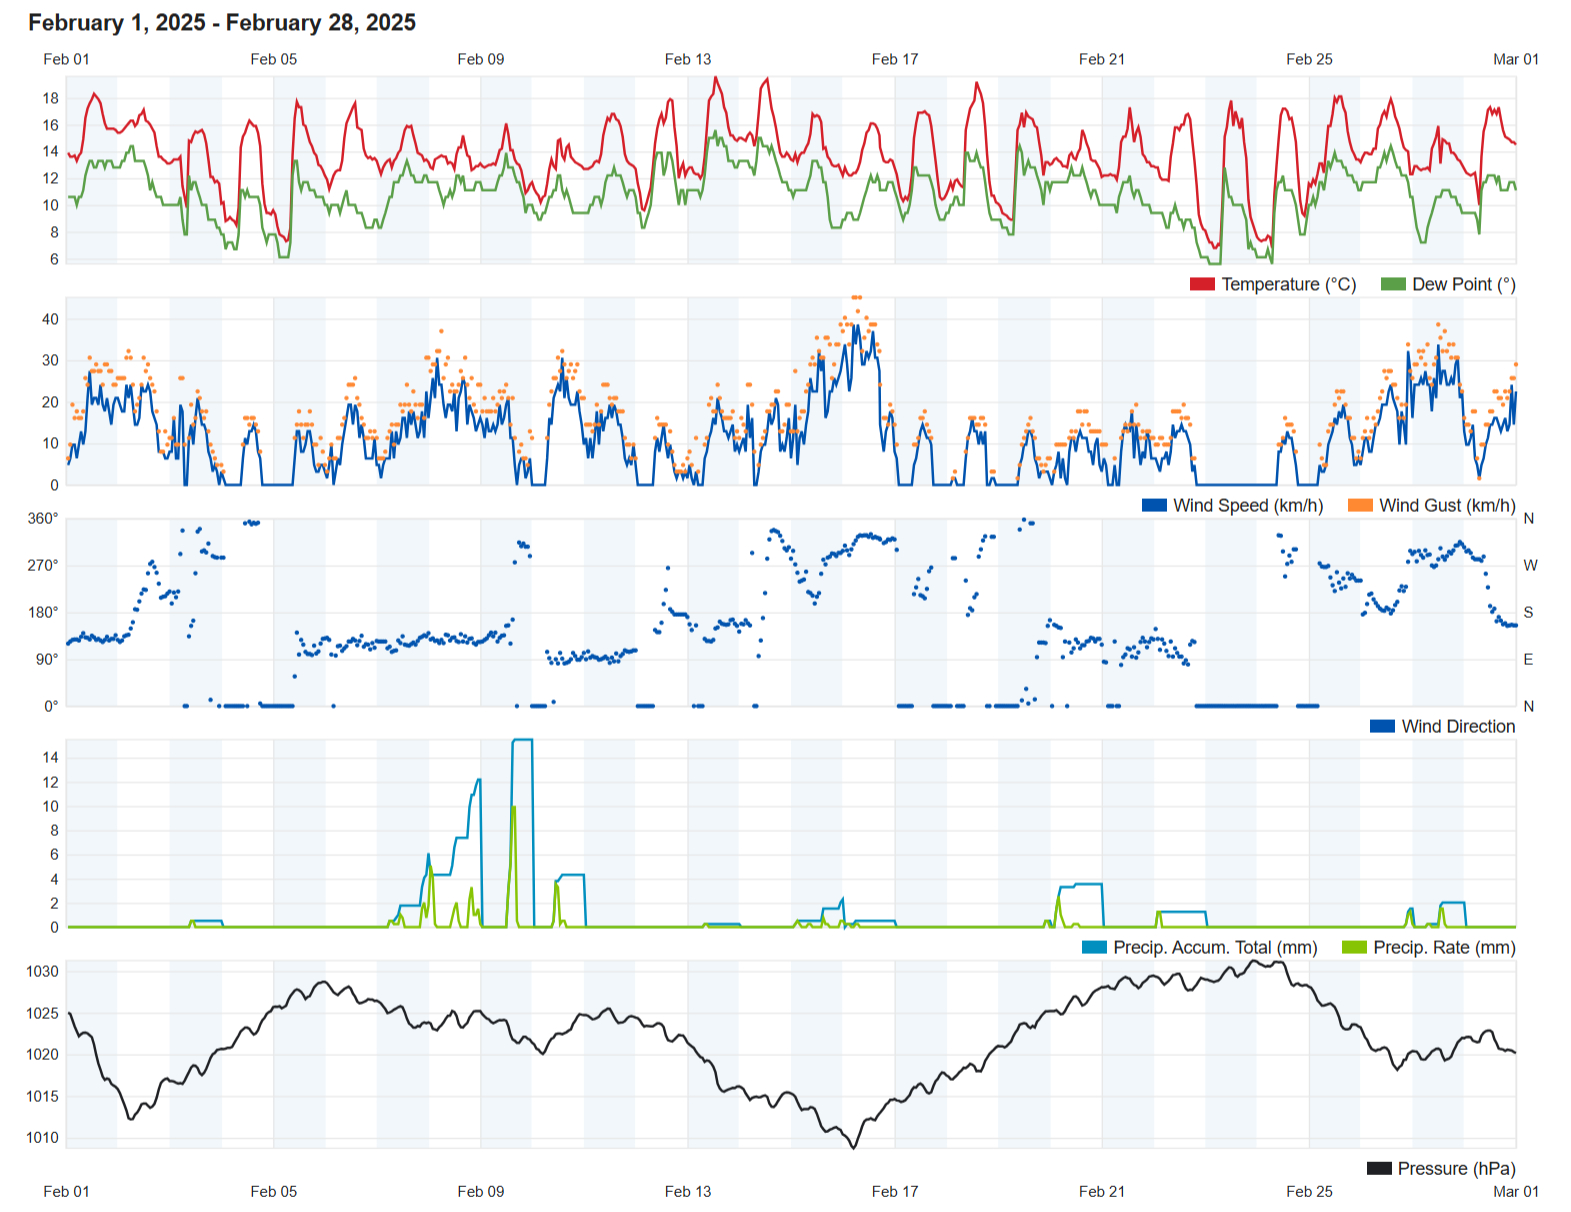
| Highest Maximum | 19.6°C | 13th |
| Lowest Maximum | 14.9°C | 10th |
| Highest Minimum | 13.2°C | 1st |
| Lowest Minimum | 5.8°C | 23rd |
| Mean Maximum | 17.1°C |
| Mean Minimum | 10.0°C |
| Mean | 13.5°C |
Relative Humidity
| Highest Relative Humidity | 95% | Numerous days |
| Lowest Relative Humidity | 58% | 22nd |
| Mean Relative Humidity | 83.6% |
Wind
| Highest Gust | 45.1km/h | 16th |
| Mean Wind Speed | 7.9km/h |
| Most Frequent Wind Direction | East Southeast |
Atmospheric Pressure
| Highest Atmospheric Pressure | 1031.3hPa | 23rd |
| Lowest Atmospheric Pressure | 1008.4hPa | 16th |
| Mean Atmospheric Pressure | 1022.0hPa |
Precipitation
| Total Rainfall During February 2025 | 66.0 mm |
| Total Rainfall Since Last 01/09 | 335.3 mm |
| Highest 24 Hour Total | 21.6 mm | 9th |
| Rain Days | 12 days |
| Thunderstorm Days | 3 days |
| Hail Days | 1 day |
Rainfall Events
| 3/2/2025 | 0.5 mm | Isolated Showers; Distant Thunder and Hail |
| 5/2/2025 | 0.0 mm | Distant Isolated Light Rain |
| 6/2/2025 | 0.0 mm | Distant Isolated Light Rain |
| 7/2/2025 | 8.0 mm | Rain Showers |
| 8/2/2025 | 15.7 mm | Rain Showers |
| 9/2/2025 | 21.6 mm | Steady Rain; Thunderstorm |
| 10/2/2025 | 6.3 mm | Rain Showers |
| 14/2/2025 | 0.0 mm | Distant Hailstorm with Large Hail |
| 15/2/2025 | 2.3 mm | Rain Showers |
| 16/2/2025 | 0.5 mm | Isolated Showers |
| 19/2/2025 | 0.6 mm | P.M. Isolated Showers |
| 20/2/2025 | 4.2 mm | A.M. Showers; Distant Steady Heavy Rain |
| 22/2/2025 | 1.3 mm | A.M. Isolated Shower |
| 26/2/2025 | 2.1 mm | P.M. Light Rain; Showers; Distant Thunder |
| 27/2/2025 | 2.9 mm | Showers; Distant Hail |
February 2025 Compared to the Climate Means
| Climate Mean | February 2025 | Anomaly | |
| Mean Maximum Temperature | 15.6°C | 17.1°C | +1.5°C |
| Mean Minimum Temperature | 9.7°C | 10.0°C | +0.3°C |
| Mean Temperature | 12.7°C | 13.5°C | +0.8°C |
| Mean Relative Humidity | 78.3% | 83.6% | -5.3% |
| Mean Atmospheric Pressure | 1020.2hPa | 1022.0hPa | +1.8hPa |
| Total Rainfall | 61.9 mm | 66.0 mm | +4.1 mm |
| Total Rainfall Since Last 01/09 | 447.4 mm | 335.3 mm | -112.1 mm |
| Total Rain Days | 11 days | 12 days | +1 day |
| Total Thunderstorm Days | 3 days | 3 days | / |
| Total Hail Days | 2 days | 1 day | -1 day |
February 2025 – Rainfall Totals Bounce Back
The 66.0 mm of precipitation measured at our weather station in Gozo was marginally above the climate norm for February. Whilst all corners of the Maltese Islands registered a wetter than average February 2025, it was the island of Malta which benefitted most from the rainfall recovery. Localities in Malta received approximately 103.2 mm over the course of February 2025. Gozitan localities, on the other hand, received only 65.2 mm. This was due to the fact that most rain-bearing systems came to our islands with easterly currents. These affect Malta far more than Gozo. A case in point was the 20th. Maltese localities experienced continuous heavy rain in the morning. Gozo only received a few showers. More than half of all days last month; 15 in total, registered rainfall. The highlight was a hailstorm with large hailstones over the southern half of Malta, particularly Birżebbuġa and Għaxaq, on Valentine’s Day. February was the second wetter than average since last September 1st, along with February.
Temperatures were significantly warmer than average, particularly during the day. The mean maximum temperature of 17.1°C exceeded the norm by 1.5°C. Overall temperatures were 0.8°C above typical values for the time of year. Temperatures in winter depend on the so-called polar vortex. This is a circulation of very cold air in the Arctic. This winter we’ve seen the polar vortex assume a stronger and more compact structure, leading to cold air remaining locked up and restricted to polar areas. It was so strong, in fact, that the temperature at the level of 30,000 above the Arctic dropped to -90°C (the coldest for the past 40 years). This state of affairs is being maintained for now. When that happens, low pressure systems from over the Sahara Desert can reach us more freely, together with more frequent southeasterly winds and warmer than average temperatures. The difference from the climate norm with minimum temperatures was of only 0.3°C. This was thanks to a number of chilly nights brought about by numerous calm and clear nights, the coldest of which was the dawn of the 23rd when the mercury dipped to 5.8°C!
Winds were weaker than normal, with less gales than normal. Atmospheric pressure averaged 1022hPa. This is stronger than normal.
Rainfall Totals around the Maltese Islands in February 2025 (and since last September 1st):
Kerċem: 66.0 mm (335.3 mm)
Victoria: 66.1 mm (339.0 mm)
Marsalforn: 63.7 mm (286.8 mm)
Xewkija: 58.6 mm (232.1 mm)
Nadur: 70.3 mm (326.2 mm)
Għajnsielem: 66.4 mm (282.0 mm)
Mellieħa: 64.6 mm (258.1 mm)
Buġibba: 77.1 mm (260.0 mm)
Mġarr: 104.7 mm (331.1 mm)
Naxxar: 98.6 mm (351.3 mm)
Mosta: 95.9 mm (343.7 mm)
Dingli: 132.4 mm (431.9 mm)
Pembroke: 100.8 (349.2 mm)
Msida: 109.6 mm (425.3 mm)
Sliema: 87.7 mm (328.2 mm)
Valletta: 103.1 mm (351.1 mm)
Fgura: 108.2 mm (412.8 mm)
Żejtun: 115.0 mm (363.9 mm)
Żabbar: 151.6 mm (426.3 mm)
Imqabba: 102.0 mm (384.3 mm)
Siġġiewi: 115.7 mm (359.2 mm)
Żurrieq: 99.8 mm (346.5 mm)
Marsaxlokk: 86.7 mm (285.9 mm)
NATIONAL MEAN: 91.9 mm (338.2 mm)