
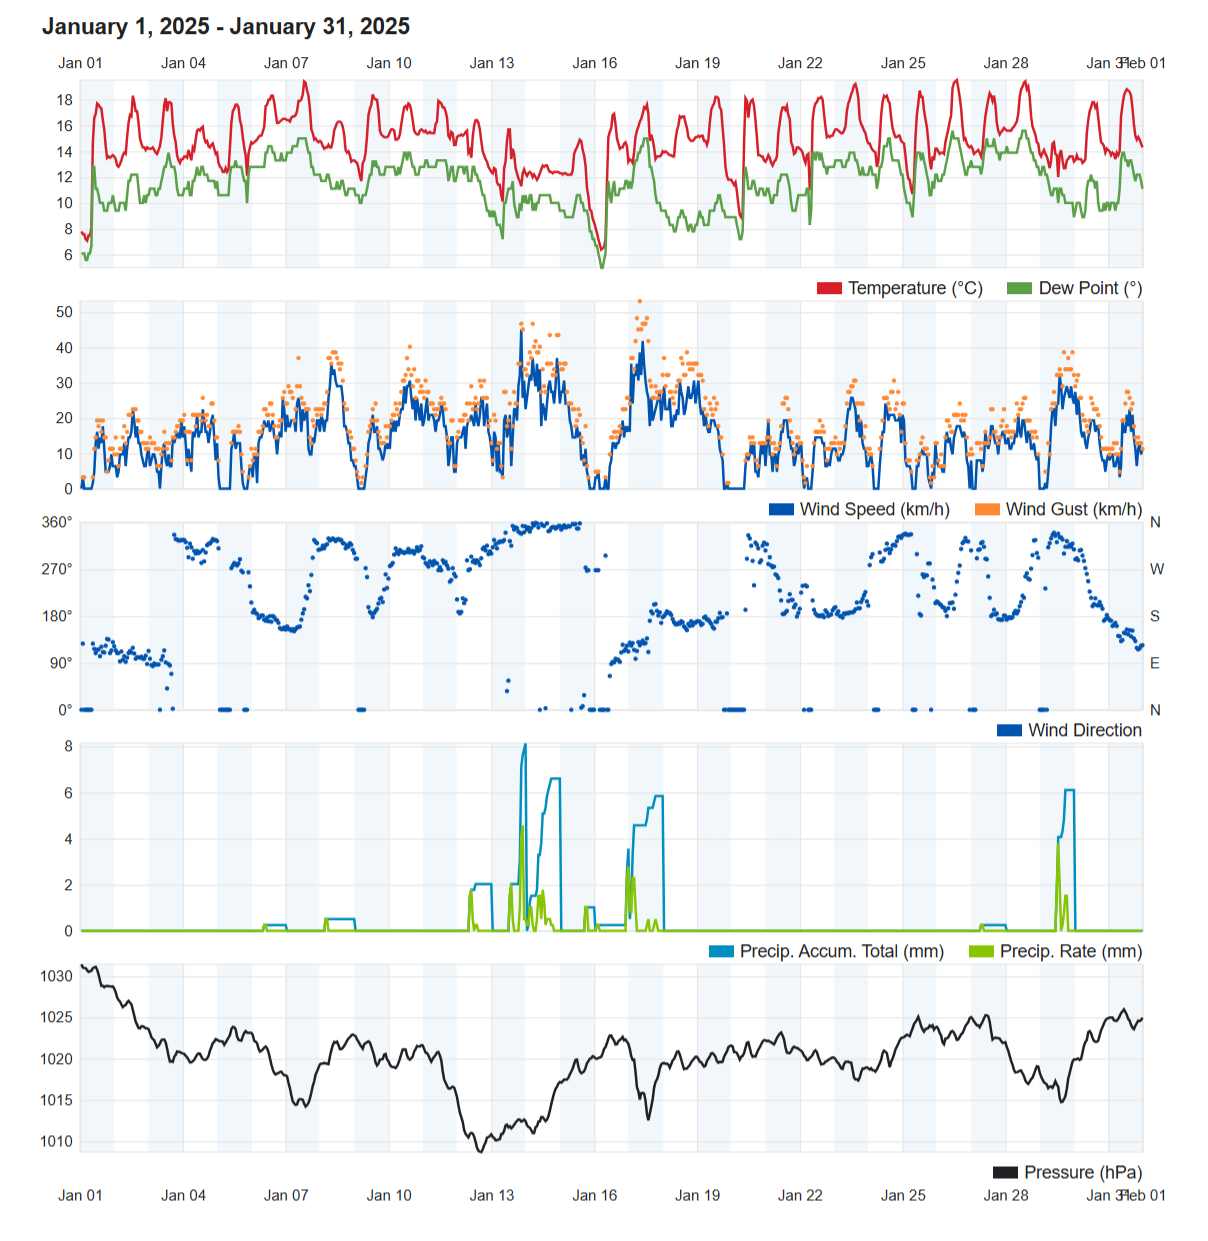
Air Temperature
| Highest Maximum | 19.5°C | 26th |
| Lowest Maximum | 12.9°C | 14th |
| Highest Minimum | 14.7°C | 10th |
| Lowest Minimum | 5.6°C | 16th |
| Mean Maximum | 17.5°C |
| Mean Minimum | 11.7°C |
| Mean | 14.6°C |
Relative Humidity
| Highest Relative Humidity | 94% | Numerous days |
| Lowest Relative Humidity | 57% | 18th |
| Mean Relative Humidity | 81.7% |
Wind
| Highest Gust | 53.1km/h | 17th |
| Mean Wind Speed | 11.1km/h |
| Most Frequent Wind Direction | Northwest |
Atmospheric Pressure
| Highest Atmospheric Pressure | 1031.4hPa | 1st |
| Lowest Atmospheric Pressure | 1008.4hPa | 12th |
| Mean Atmospheric Pressure | 1020.1hPa |
Precipitation
| Total Rainfall During January 2025 | 52.8 mm |
| Total Rainfall Since Last 01/09 | 269.3 mm |
| Highest 24 Hour Total | 12.3 mm | 13th |
| Rain Days | 8 days |
| Thunderstorm Days | 3 days |
| Hail Days | 1 day |
Rainfall Events
| 2/1/2025 | 0.0 mm | Distant Isolated Light Rain |
| 3/1/2025 | 0.0 mm | Distant Isolated Showers |
| 4/1/2025 | 0.0 mm | Distant Isolated Showers |
| 8/1/2025 | 0.8 mm | Light Rain |
| 12/1/2025 | 3.5 mm | A.M. Shower |
| 13/1/2025 | 12.3 mm | P.M. Heavy Rain |
| 14/1/2025 | 10.1 mm | Showers; Distant Thunder |
| 15/1/2025 | 1.0 mm | P.M. Shower |
| 16/1/2025 | 6.2 mm | A.M. Isolated Shower; P.M. Steady Rain |
| 17/1/2025 | 10.2 mm | A.M. Steady Rain; P.M. Thunderstorm with Hail |
| 18/1/2025 | 0.0 mm | Distant Light Rain |
| 20/1/2025 | 0.0 mm | Distant Isolated Showers |
| 21/1/2025 | 0.0 mm | Distant Isolated Showers |
| 29/1/2025 | 8.7 mm | Light to Moderate Rain; Distant Thunder |
| 30/1/2025 | 0.0 mm | Distant A.M. Light Rain |
January 2025 Compared to the Climate Means
| Climate Mean | January 2025 | Anomaly | |
| Mean Maximum Temperature | 15.6°C | 17.5°C | +1.9°C |
| Mean Minimum Temperature | 10.1°C | 11.7°C | +1.6°C |
| Mean Temperature | 12.8°C | 14.6°C | +1.8°C |
| Mean Relative Humidity | 78.4% | 81.7% | +3.3% |
| Mean Atmospheric Pressure | 1021.7hPa | 1020.1hPa | -1.6hPa |
| Total Rainfall | 69.4 mm | 52.8 mm | -16.6 mm |
| Total Rainfall Since Last 01/09 | 385.5 mm | 269.3 mm | -116.2 mm |
| Total Rain Days | 14 days | 8 days | -6 days |
| Total Thunderstorm Days | 4 days | 3 days | -2 days |
| Total Hail Days | 2 days | 1 day | -2 day |
Springtime Temperatures in January 2025
Almost half of all days (15) last January were characterized by at least one shower over one area or another of the Maltese Islands. Rain was measured at our weather station on eight of these. Thunder was heard on three of these while hail was recorded once. Despite these days of rain, January’s total precipitation of 63.0 mm was less than the value for a typical January. The total rainfall at our weather station was at an even lower 52.8 mm.
Apart from being drier than the climate norm, the month was also warmer than expected at this time of year. In fact, it was among the warmest Januarys ever. The mean temperature of 14.6°C exceeded the climate average by 1.8°C. This comprised a mean maximum temperature of 17.5°C (1.9°C warmer than average) and a mean minimum temperature of 11.7°C (1.6°C warmer than average). These temperatures are more typical of Easter time rather than the peak of winter! The maximum temperature of 19.5°C on January 26th was far from breaking absolute temperature records, however. A calm and clear night on the 16th accounted for the month’s coldest minimum temperature of 5.6°C.
Rainfall Totals around the Maltese Islands in January 2025 (and since last September 1st):
Kerċem: 52.8 mm (269.3 mm)
Victoria: 52.2 mm (272.9 mm)
Marsalforn: 51.5 mm (223.1 mm)
Xewkija: 55.7 mm (173.5 mm)
Nadur: 51.6 mm (255.9 mm)
Għajnsielem: 67.5 mm (215.6 mm)
Mellieħa: 67.0 mm (193.5 mm)
Buġibba: 52.6 mm (182.9 mm)
Mġarr: 70.1 mm (226.4 mm)
Naxxar: 68.1 mm (252.7 mm)
Mosta: 62.0 mm (247.8 mm)
Dingli: 101.1 mm (299.5 mm)
Pembroke: 64.0 mm (248.2 mm)
Msida: 75.3 mm (315.7 mm)
Sliema: 68.4 mm (240.5 mm)
Valletta: 61.6 mm (248.0 mm)
Fgura: 72.1 mm (304.6 mm)
Żejtun: 53.7 mm (248.9 mm)
Żabbar: 62.5 mm (274.7 mm)
Imqabba: 80.9 mm (282.3 mm)
Siġġiewi: 68.2 mm (243.5 mm)
Żurrieq: 63.2 mm (246.7 mm)
Marsaxlokk: 47.4 mm (199.2 mm)
NATIONAL MEAN: 63.0 mm (246.3 mm)